Eurozone economic data has been led to a series of disappointments by Germany, which has enforced the European Central Bank’s monetary policy designed to weaken the Euro. The trading bloc’s main exporter is struggling but refuses to increase fiscal spending. The German finance ministry maintains its position that this soft patch will pass without the need to boost spending. US economic data showed signs of surprises in secondary reports, providing enough momentum to extend the sell-off in the EUR/USD, now seeking stability inside of its support zone.
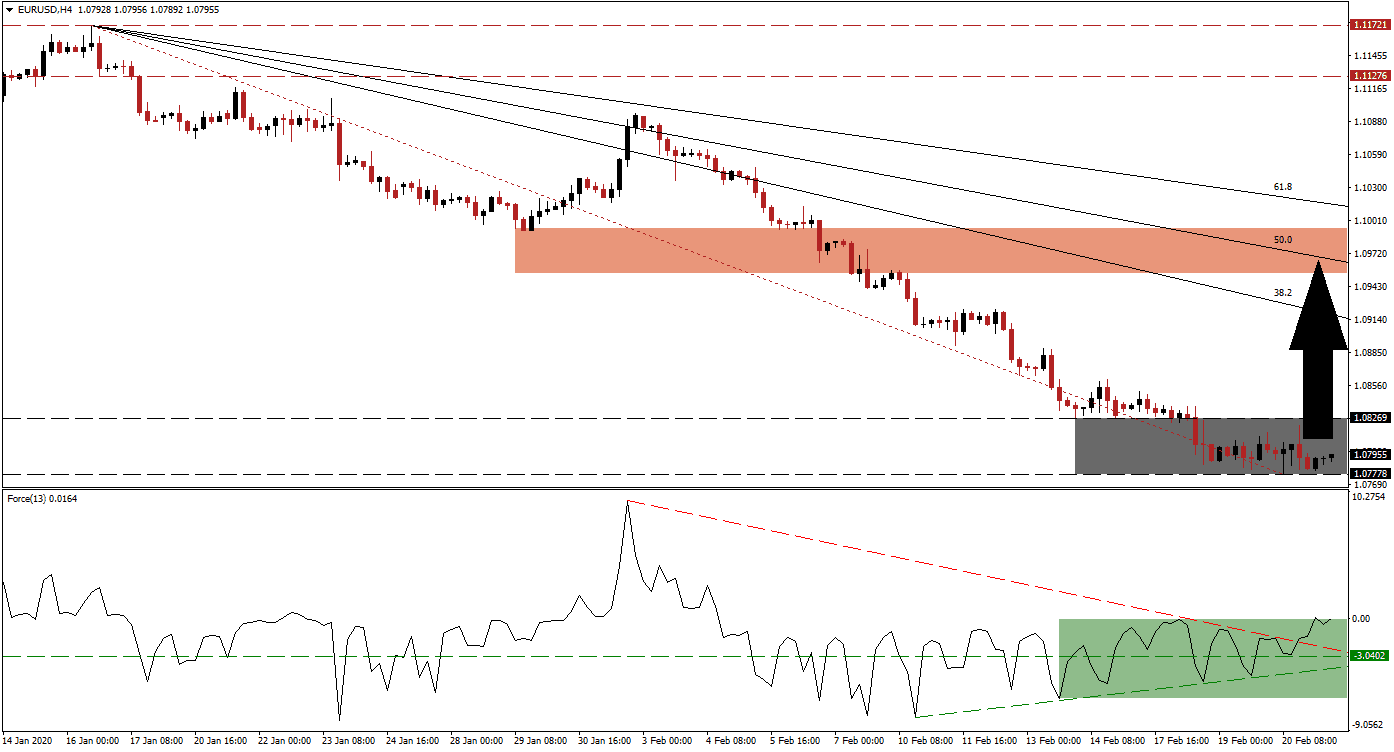
The Force Index, a next-generation technical indicator, points towards the emergence of a positive divergence. While this currency pair embarked on a massive sell-off, the Force Index started to move higher. Bullish pressures increase after the horizontal resistance level was converted into support, assisted by its ascending support level. This technical indicator additionally eclipsed its descending resistance level, as marked by the green rectangle. After the crossover above the 0 center-line, bulls have taken control of price action in the EUR/USD.
Adding to bullish developments is the move in price action above its Fibonacci Retracement Fan trendline. This occurred inside of its support zone located between 1.07778 and 1.08269, as marked by the grey rectangle. A breakout is anticipated to inspire a short-covering rally in this currency pair, allowing the EUR/USD to exit extremely oversold conditions. It will also close the gap to its descending 38.2 Fibonacci Retracement Fan Resistance Level. You can learn more about a short-covering rally here.
While short-term technical developments support a temporary reversal, the long-term outlook remains challenging. Persistent Eurozone economic weakness meets US political uncertainty amid an economy predicted to underperform. Forex traders are advised to monitor the EUR/USD as it will approach its 50.0 Fibonacci Retracement Fan Resistance Level, currently crossing through its short-term resistance zone located between 1.09548 and 1.09942, as marked by the red rectangle. It may enforce the dominant downtrend in price action, preventing a breakout to extend the pending advance.
EUR/USD Technical Trading Set-Up - Short-Covering Scenario
Long Entry @ 1.07950
Take Profit @ 1.09000
Stop Loss @ 1.07650
Upside Potential: 105 pips
Downside Risk: 30 pips
Risk/Reward Ratio: 3.50
A breakdown in the Force Index below its ascending support level may pressure the EUR/USD to follow suit. This will lead to an extended corrective phase after the closure of a previous price gap to the upside. Price action will challenge its next support zone between 1.06420 and 1.06819 from where more downside will require a fresh fundamental catalyst. With anticipated US weakness, the closure of the existing price gap may signal the end of the dominant bearish trend, but extreme caution is advised.
EUR/USD Technical Trading Set-Up - Breakdown Scenario
Short Entry @ 1.07350
Take Profit @ 1.06650
Stop Loss @ 1.07650
Downside Potential: 70 pips
Upside Risk: 30 pips
Risk/Reward Ratio: 2.33


