The difference between success and failure in Forex trading is very likely to depend upon which currency pairs you choose to trade each week, and not on the exact trading methods you might use to determine trade entries and exits. Each week I am going to analyze fundamentals, sentiment and technical positions in order to determine which currency pairs are most likely to produce the easiest and most profitable trading opportunities over the next week. In some cases, it will be trading the trend. In other cases, it will be trading support and resistance levels during more ranging markets.
Big Picture 2nd February 2020
In my previous piece last week, I forecasted that the best trade was likely to be long of Gold in USD terms following a daily close above $1575. Monday saw a close at $1581.94 and it then went on to rise by 0.51% by the end of the week, so this was a profitable trade which produced a win.
Last week’s Forex market again saw the strongest rise in the relative value of the Japanese Yen, and the strongest fall in the relative value of the Australian Dollar.
Fundamental Analysis & Market Sentiment
Fundamental analysts are leaning in favor of a weaker USD as the Federal Reserve is set on a course of inflating its balance sheet, and as there is little prospect of a rate increase in the foreseeable future. Last week’s Advance GDP growth figure came in at 2.1% which was what the market had been expected.
The Chinese coronavirus outbreak has continued to worsen, surpassing SARS in a key metric, and it looks likely that meaningful damage will be inflicted upon the Chinese economy. Asian stock markets have been selling off over most of the week and the U.S. stock market has seemingly also caught the contagion, with the key S&P 500 Index falling by about 2% on Friday.
The “risk off” sentiment has caused a flight into safety which sees money flow into Gold and the Japanese Yen. The U.S. Dollar also sold off on Friday.
The Australian Dollar as well as other commodity currencies has been hit hard, with Australia suffering particularly due to its heavy exposure to the Chinese economy.
Technical Analysis
U.S. Dollar Index
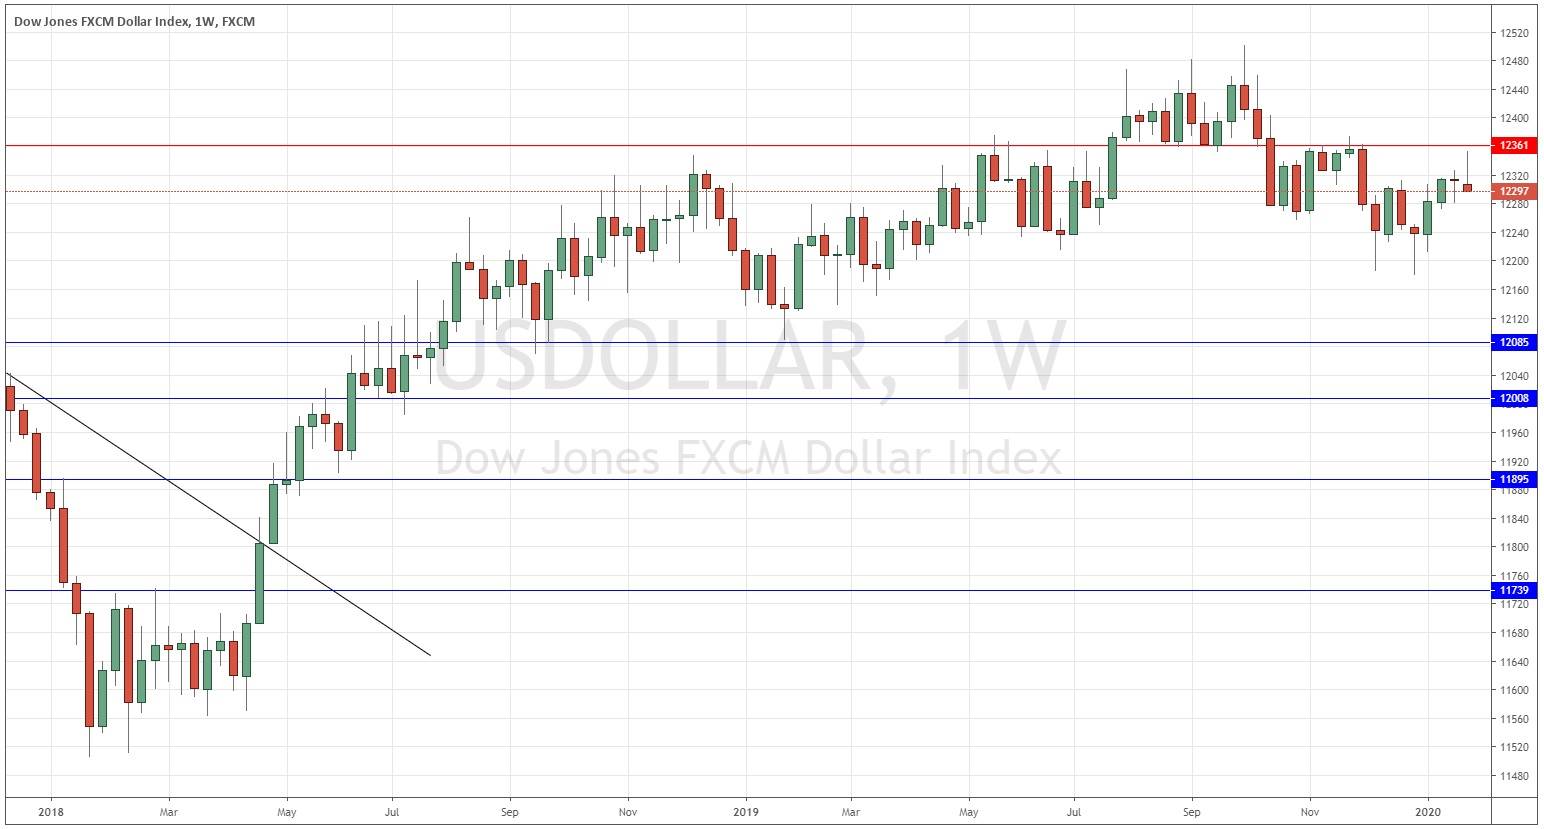
The weekly price chart below shows last week printed a slightly small bearish pin candlestick. The previous week’s candlestick was nearly an inside candlestick, so this combination looks quite bearish. The high of last week also got close to the resistance level at 12361 which is another bearish sign. The long-term trends are mixed, with the price below its level from 6 months ago but slightly above its level from 3 months ago, which indicates a mixed but somewhat bearish trend. Therefore, there is technical evidence that we are likely to see a further downwards move in the U.S. Dollar Index next week.
GOLD/USD
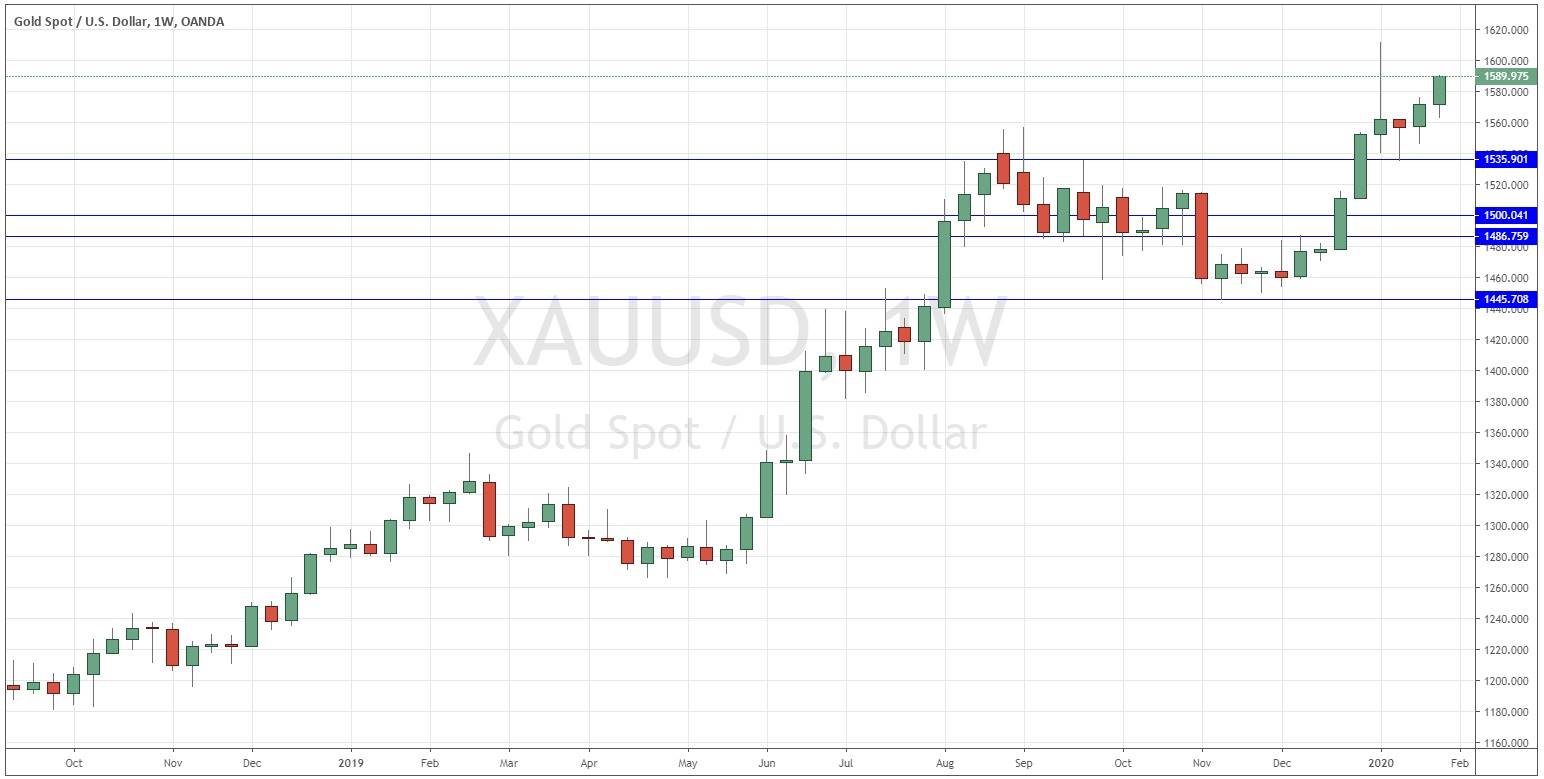
Gold in USD terms just made its highest weekly close in more than six and a half years. The weekly candlestick was not especially large but was a reasonably-sized bullish candlestick which closed very near to the top of its price range, which is a bullish sign.
AUD/USD
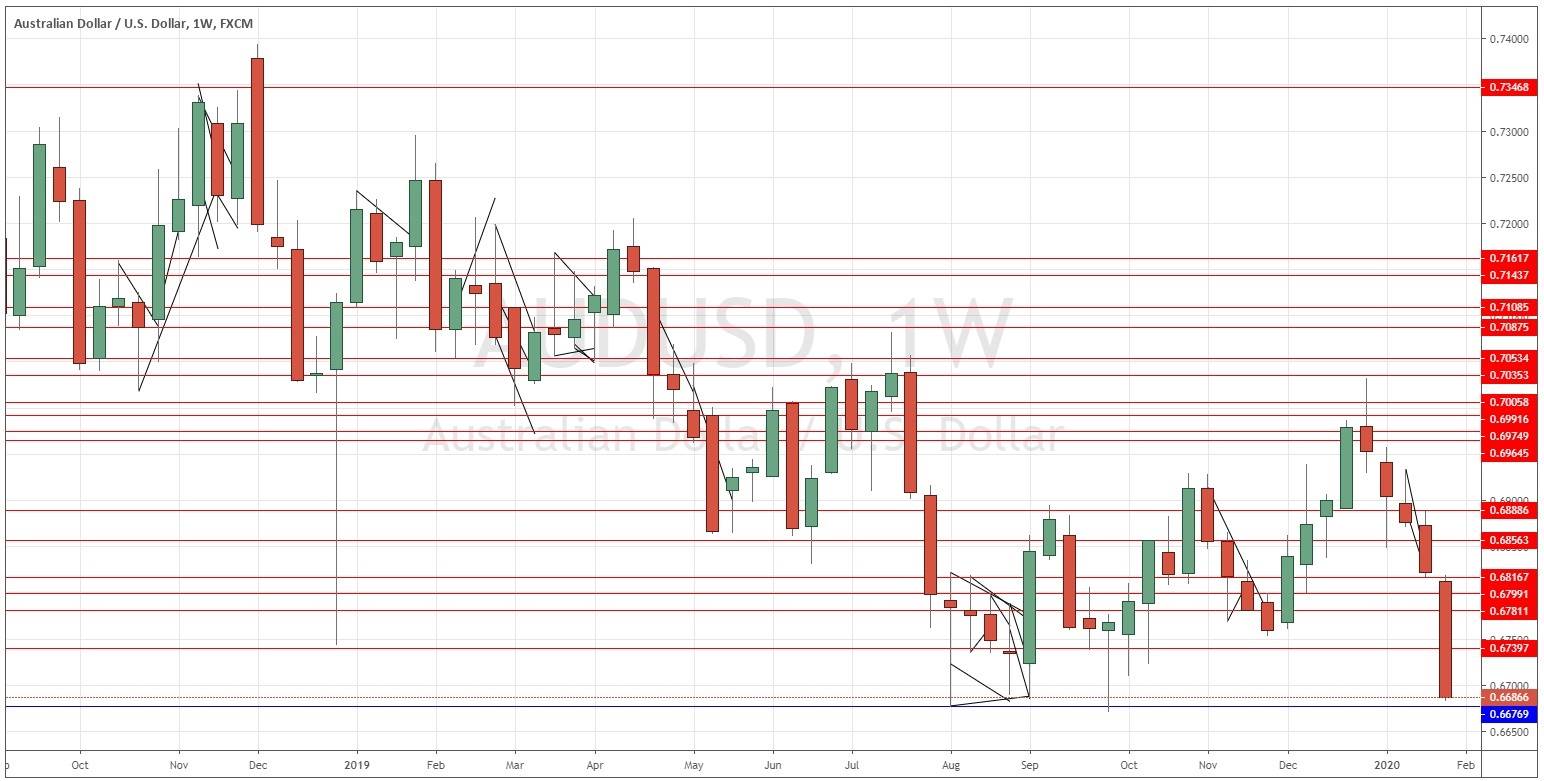
The AUD/USD currency pair just made its lowest weekly close in more than ten years. The weekly candlestick was a very large bearish engulfing candlestick which closed very near to the bottom of its price range, which is a bearish sign.
Conclusion
This week I forecast the best trade is likely to be long of Gold, half in USD terms and half in AUD terms.


