The difference between success and failure in Forex trading is very likely to depend upon which currency pairs you choose to trade each week, and not on the exact trading methods you might use to determine trade entries and exits. Each week I am going to analyze fundamentals, sentiment and technical positions in order to determine which currency pairs are most likely to produce the easiest and most profitable trading opportunities over the next week. In some cases, it will be trading the trend. In other cases, it will be trading support and resistance levels during more ranging markets.
Big Picture 16th February 2020
In my previous piece last week, I forecasted that the best trades were likely to be short of both EUR/USD and AUD/USD. Over the week, EUR/USD fell by 1.07% while the AUD/USD currency pair rose by 0.51%, so overall these were winning trades with an averaged win of 0.23%.
Last week’s Forex market saw the strongest rise in the relative value of the British Pound, and the strongest fall in the relative value of the Euro.
Fundamental Analysis & Market Sentiment
Fundamental Analysts are now tending to see less chance of a U.S. rate cut after recent releases of stronger than expected economic data which surprised the market, sending the U.S. Dollar higher almost everywhere. The non-farm payrolls employment change came in very strong at 225 thousand new jobs when only 163 thousand had been expected. However, the past week saw all U.S. numbers arrive more or less as expected.
The Euro saw weaker sentiment as the British government, having secured Brexit, is now in a much stronger negotiating position with the E.U. and made it clear that it is prepared to walk away at the end of the 2020 transition year without a trade deal. Despite weak British GDP growth, sentiment on the Pound is a little more bullish than it had been.
The Chinese coronavirus outbreak may have stabilized, with new data just released suggesting that the outbreak has peaked. Stock markets broadly rose last week, especially the U.S. and German markets which both hit new all-time high prices.
Technical Analysis
U.S. Dollar Index
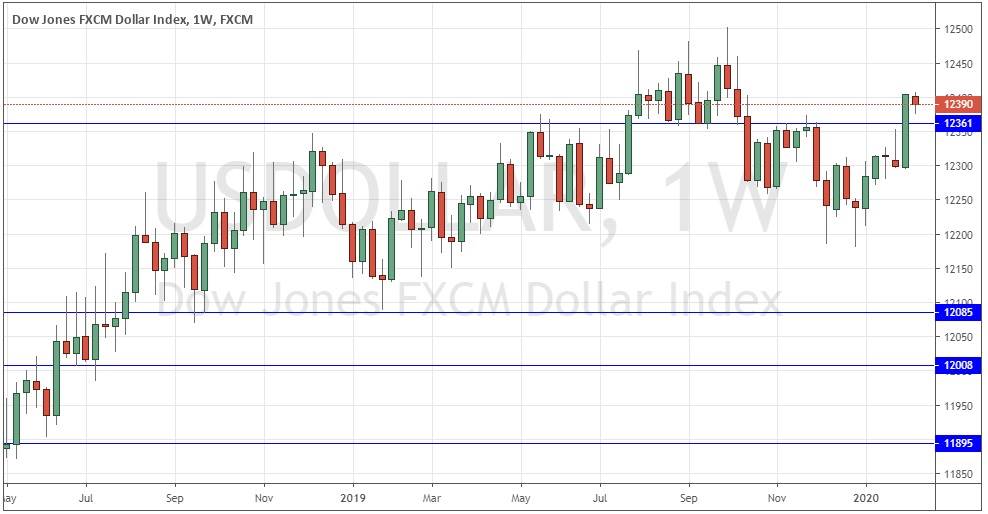
The weekly price chart below shows last week printed a small and slightly bearish candlestick. However, the bearish retracement represented by this candlestick was small, and the support level at 12361 has continued to hold, which are bullish signs. The long-term trends are now more bullish, with the price only just below its level from 6 months ago and clearly above its level from 3 months ago, which indicates a weak but basically bullish trend. Therefore, there is technical evidence that we are likely to see a further upwards move in the U.S. Dollar Index next week.
EUR/USD
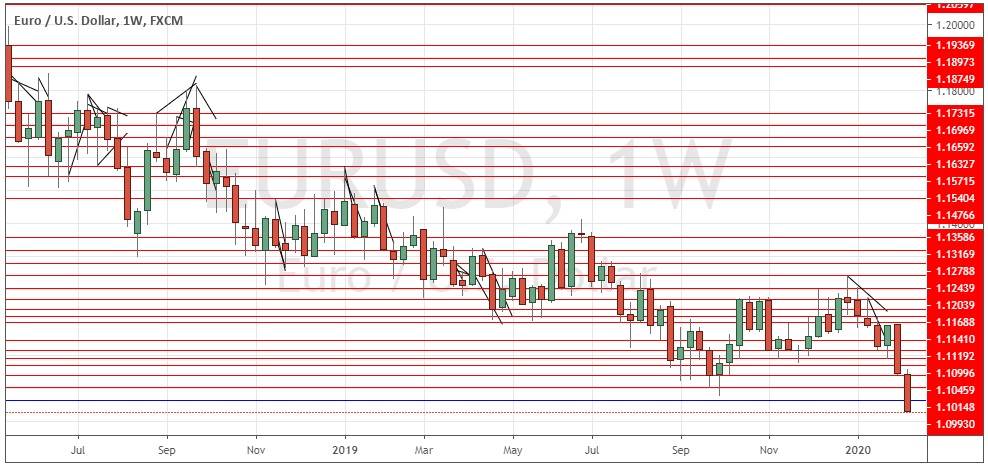
The EUR/USD currency pair just made its lowest weekly close in nearly three years. The weekly candlestick was large and closed right on its low, which are bearish signs. There is a slow but strengthening convincing long-term bearish trend and the price looks likely to fall further over the coming week.
S&P 500 Index
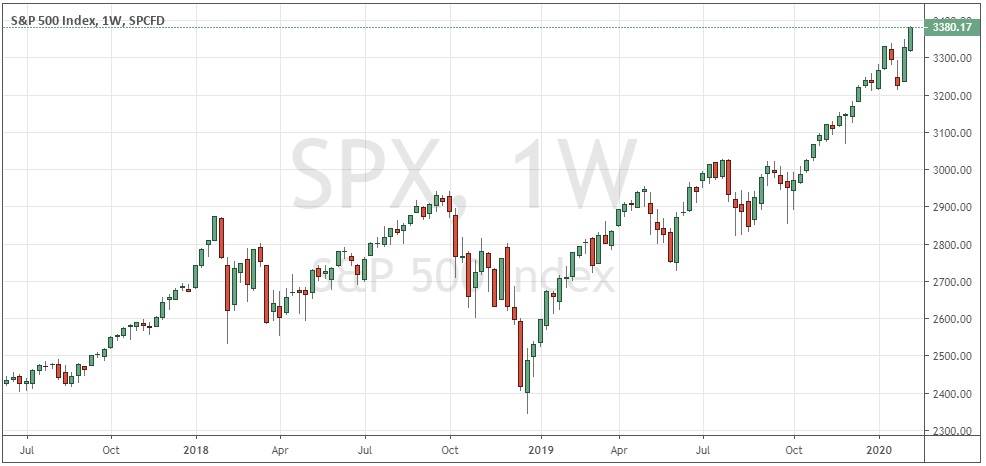
The S&P 50 Index just made its highest ever weekly close, hitting a new all-time high price. The weekly candlestick was bullish and of a reasonably strong size, and also closed very near to the top of its price range, all of which are bullish signs.
Conclusion
This week I forecast the best trades are likely to be short of EUR/USD and long of the S&P 500 Index.


