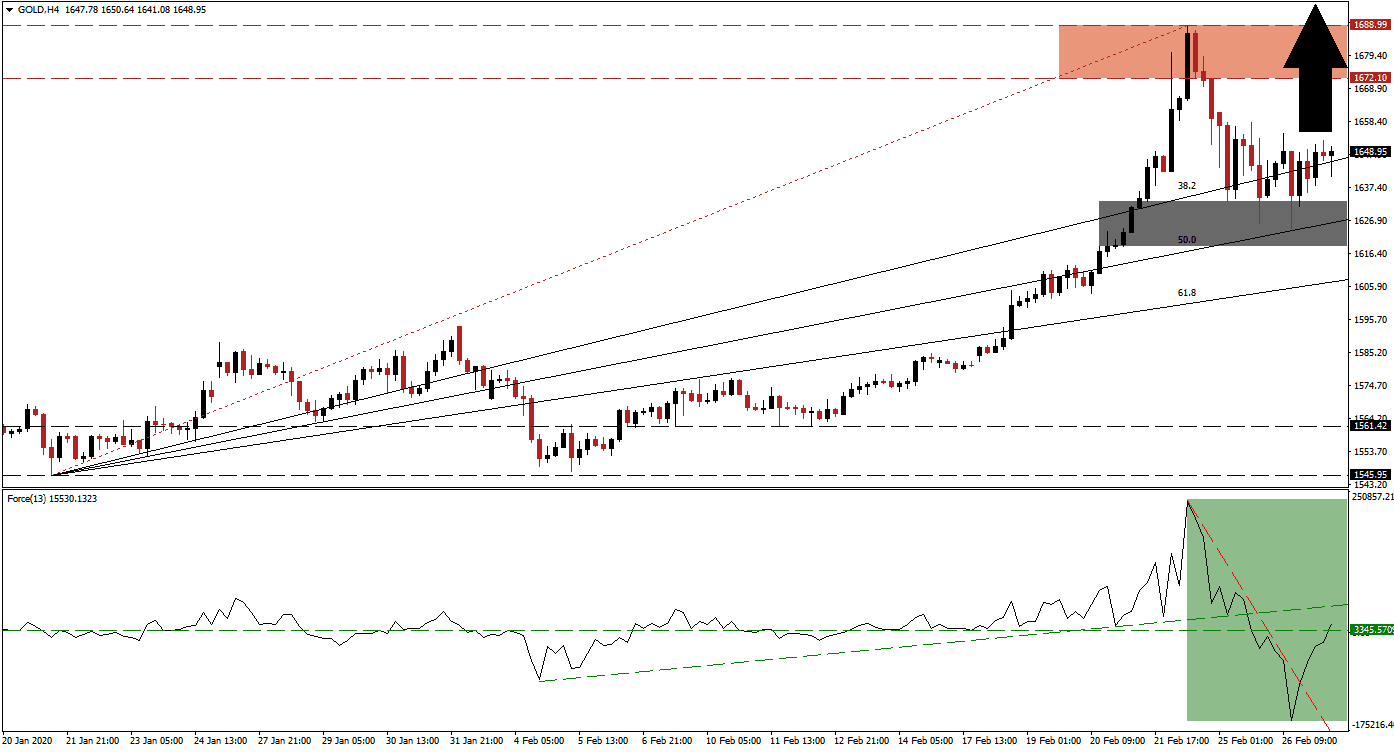
Before the outbreak of the deadly Covid-19, the global economy was amid a slowdown, fueled by structural issues. The fragile state of the economy was ill-prepared to handle an external shock, with few exceptions, and it remains premature to gauge the impact of it. Due to the uncertainty, safe-haven assets led by gold are in high demand. Throughout 2019 this precious metal established a dominant bullish trend, which led to a seven-year high earlier this week. Price action retreated into its newly formed short-term support zone from where a fresh advance is favored.
The Force Index, a next-generation technical indicator, plunged to a new 2020 low while price action reversed from its 2020 peak. A quick reversal followed, and bullish momentum is expanding. Due to the sharp contraction, a steep descending resistance level formed but has been invalidated as the Force Index pushed through it. The horizontal resistance level has been converted back to support, as marked by the green rectangle. Bulls are in control of gold after this technical indicator eclipsed the 0 center-line, and is now on track to retake its ascending support level, which currently acts as temporary resistance.
As the bullish chart pattern was confirmed through a series of higher highs and higher lows, the short-term support zone continues to move higher. This zone is now located between 1,618.84 and 1,633.00, as marked by the grey rectangle, enforced by its ascending 50.0 Fibonacci Retracement Fan Support Level. It provides continuous upside pressure on this precious metal, maintaining the long-term uptrend in gold, and limiting the downside potential for short-term price action reversals. You can learn more about the Fibonacci Retracement Fan here.
After gold bounced off of its 50.0 Fibonacci Retracement Fan Support Level, momentum sufficed to carry it above its 38.2 Fibonacci Retracement Fan Support Level. This resulted in a rise in bullish pressures. Price action is anticipated to close the gap to its resistance zone located between 1,672.10 and 1,688.99, as marked by the red rectangle. A breakout is expected to spike this precious metal above its next psychological resistance level of 1,700, allowing it to challenge its resistance zone located between 1,762.87 and 1,790.26, dating back to February 2012.
Gold Technical Trading Set-Up - Short-Covering Scenario
Long Entry @ 1,648.00
Take Profit @ 1,790.00
Stop Loss @ 1,610.00
Upside Potential: 14,200 pips
Downside Risk: 3,800 pips
Risk/Reward Ratio: 3.74
In the event of rejection in the Force Index by its ascending support level, gold is likely to face more temporary selling pressure on the back of profit-taking. A push below its 61.8 Fibonacci Retracement Fan Support Level will clear the path for a wider corrective phase, limited to its support zone located between 1,545.95 and 1,561.42. This will represent an excellent long-term buying opportunity, as the outlook remains extremely bullish.
Gold Technical Trading Set-Up - Limited Breakdown Scenario
Short Entry @ 1,590.00
Take Profit @ 1,550.00
Stop Loss @ 1,610.00
Downside Potential: 4,000 pips
Upside Risk: 2,000 pips
Risk/Reward Ratio: 2.00

