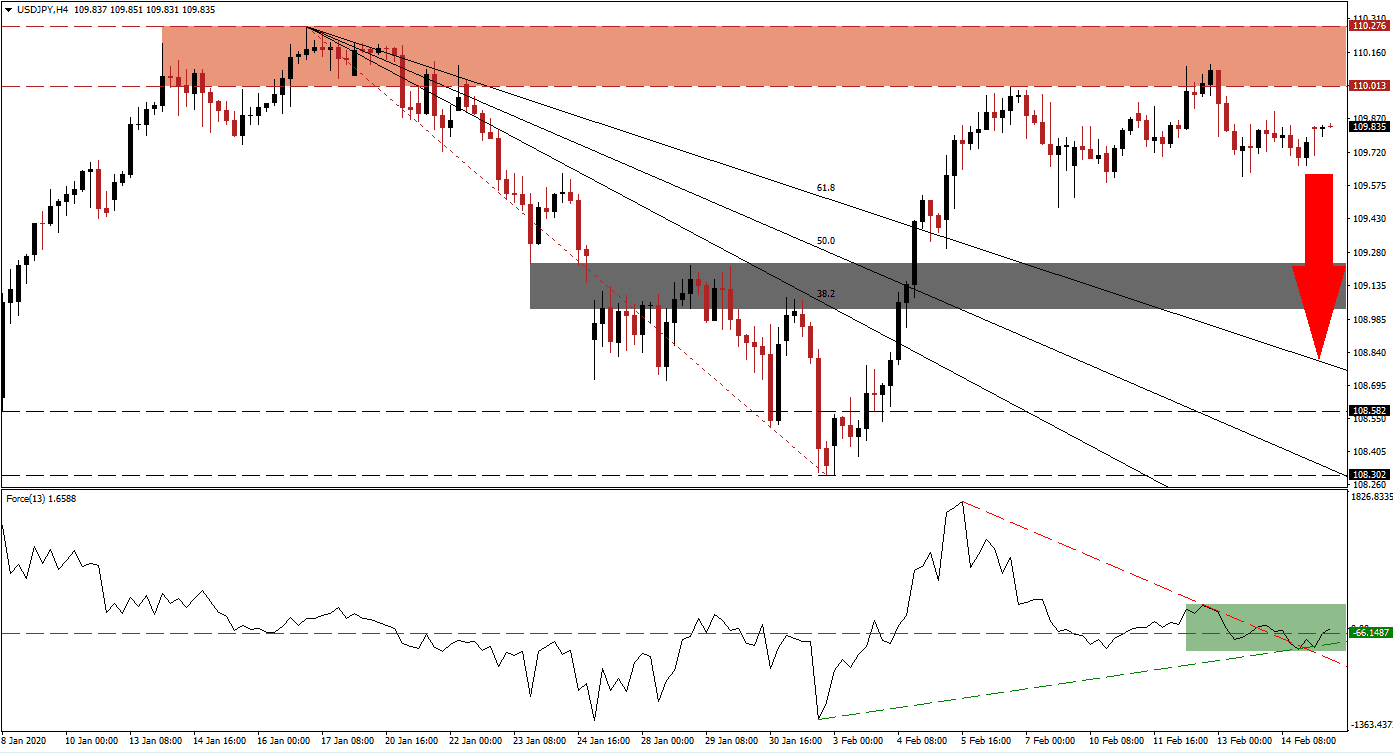
Preliminary fourth-quarter GDP data out of Japan showed a steeper contraction than expected, driven by a slump in business spending and private consumption. Despite the dismal data, the Japanese Yen remained firm. Forex traders showed stable safe-haven demand as Covid-19 continues to pose a threat to the global supply change. The Japanese economy is used to volatile GDP reports and contractions followed by bursts, a pattern that emerged after Japan bailed out its financial system over two decades ago. Breakdown pressures in the USD/JPY are dominant, and a fresh push to the downside is favored.
The Force Index, a next-generation technical indicator, shows early signs of recovery but failed to elevate this currency pair. After bouncing off of its ascending support level, a breakout above its descending resistance level followed. The Force Index then converted its horizontal resistance level into support, as marked by the green rectangle. This technical indicator crossed above its 0 center-line, but failure in the USD/JPY to follow through indicated weak bullish momentum vulnerable to a reversal. You can learn more about the Force Index here.
Adding to bearish developments in this currency pair is the emergence of a head-and-shoulders chart pattern below its resistance zone, suggesting a price action reversal. The resistance zone is located between 110.013 and 110.276, as marked by the red rectangle, which rejected an extension of the advance. A sell-off from current levels would create a lower high, adding to long-term bearish developments. US economic data has been strong in the headline figures, but soft in core elements. This is further limiting the upside potential in the USD/JPY.
Two key levels to monitor are the intra-day lows of 109.616 and 109.479, both reactions lows after this currency pair was rejected by its resistance zone. A breakdown is expected to initiate the next wave of sell-orders in the USD/JPY, driving it into its short-term support zone located between 109.030 and 109.235, as marked by the grey rectangle. This will close a price gap to the downside, but price action is anticipated to extend its slide until it can challenge its descending Fibonacci Retracement Fan sequence, which may extend the corrective phase farther to the downside.
USD/JPY Technical Trading Set-Up - Breakdown Extension Scenario
Short Entry @ 109.850
Take Profit @ 108.700
Stop Loss @ 110.150
Downside Potential: 115 pips
Upside Risk: 30 pips
Risk/Reward Ratio: 3.83
An extended recovery in the Force Index guided by its ascending support level is likely to inspire a third breakout attempt in the USD/JPY. With the dominant threats to an already weak global economy, the upside potential for this currency pair is limited to its next resistance zone. Price action will reach this zone, located between 110.955 and 111.175, which should be considered an excellent short-selling opportunity.
USD/JPY Technical Trading Set-Up - Limited Breakout Scenario
Long Entry @ 110.400
Take Profit @ 111.000
Stop Loss @ 110.150
Upside Potential: 60 pips
Downside Risk: 25 pips
Risk/Reward Ratio: 2.40


