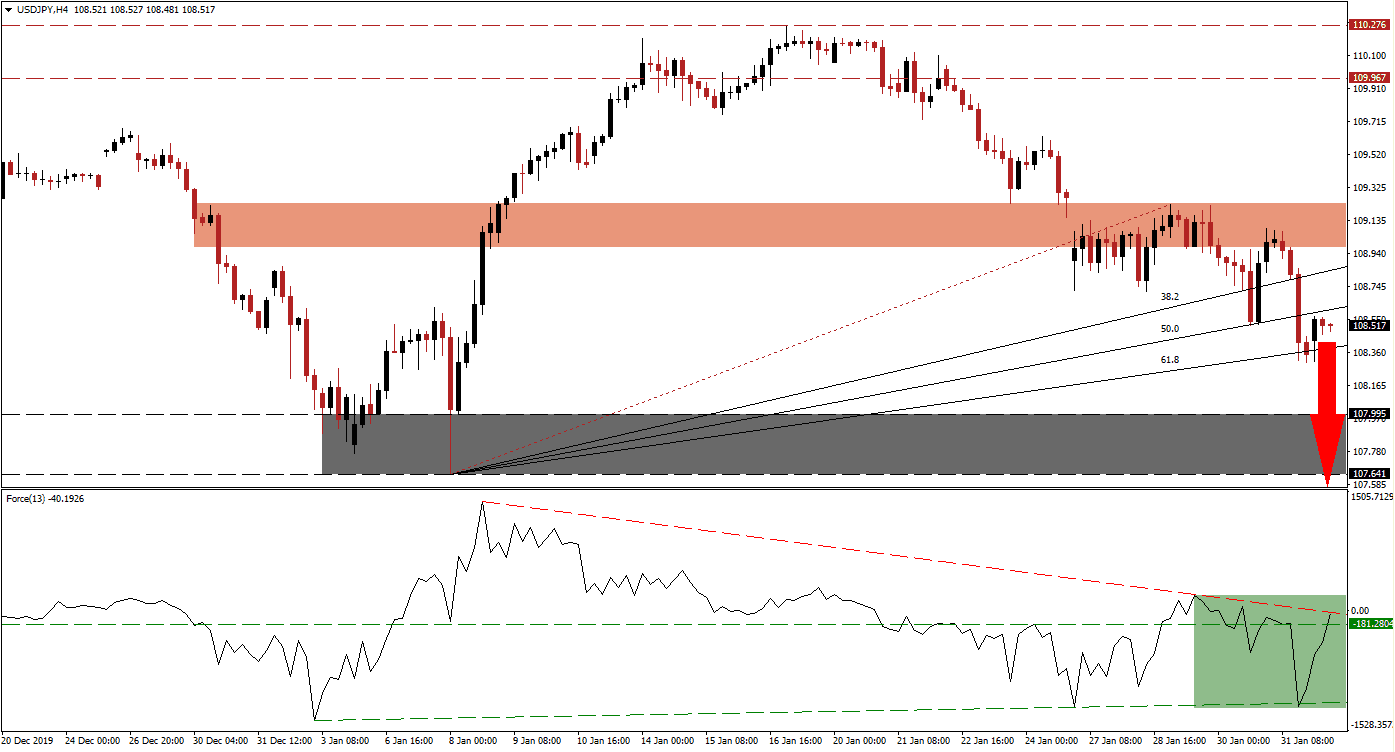
With the rise in confirmed cases as well as a growing death toll in the coronavirus, crippling the global supply chain, safe-haven assets like the Japanese Yen are in demand. Forex traders ignore the Japanese domestic economic situation, today’s PMI data confirmed an ongoing manufacturing recession, and focus on the safe-haven appeal of the Japanese currency. The breakdown sequence paused after the USD/JPY reached it's redrawn ascending 61.8 Fibonacci Retracement Fan Support Level, from where a new breakdown is pending.
The Force Index, a next-generation technical indicator, recovered after briefly piercing its shallow ascending support level, creating a marginally lower low. Despite the bullish momentum recovery, this currency pair remained in its bearish trend. The Force Index eclipsed its horizontal support level but is now faced with its descending resistance level, as marked by the green rectangle. Bears are in control of the USD/JPY with this technical indicator in negative conditions. You can learn more about the Force Index here.
After price action initiated its sell-off from its long-term resistance zone located between 109.967 and 110.276, fears over the global economic impact resulting from the coronavirus fueled the contraction. A price gap to the downside intensified the bearish chart pattern, leading to a conversion of its short-term support zone into resistance. This zone is located between 108.975 and 109.235, as marked by the red rectangle. The USD/JPY is expected to reignite the corrective phase with a breakdown below its 61.8 Fibonacci Retracement Fan.
This currency pair is positioned to descend into its support zone located between 107.641 and 107.995, as marked by the grey rectangle. Given the early phase of the negative global economic impact, the risk-off mood is anticipated to dominate. An extension of the breakdown sequence remains a possibility, which may take the USD/JPY into its next support zone between 106.481 and 106.769, before stabilizing. US economic data has shown a weak consumer, on the back of a soft housing market, adding to downside pressure in this currency pair. You can learn more about a support zone here.
USD/JPY Technical Trading Set-Up - Breakdown Extension Scenario
Short Entry @ 108.500
Take Profit @ 106.500
Stop Loss @ 109.150
Downside Potential: 200 pips
Upside Risk: 65 pips
Risk/Reward Ratio: 3.08
A move in the Force Index above its descending resistance level and into positive territory may inspire a breakout attempt in the USD/JPY. Caution is recommended, as a second push into its short-term resistance zone will keep the long-term downtrend intact. Even a confirmed breakout has limited upside potential provided by its long-term resistance zone, which represents an excellent short-selling opportunity.
USD/JPY Technical Trading Set-Up - Limited Breakout Scenario
Long Entry @ 109.300
Take Profit @ 110.200
Stop Loss @ 108.900
Upside Potential: 90 pips
Downside Risk: 40 pips
Risk/Reward Ratio: 2.25


