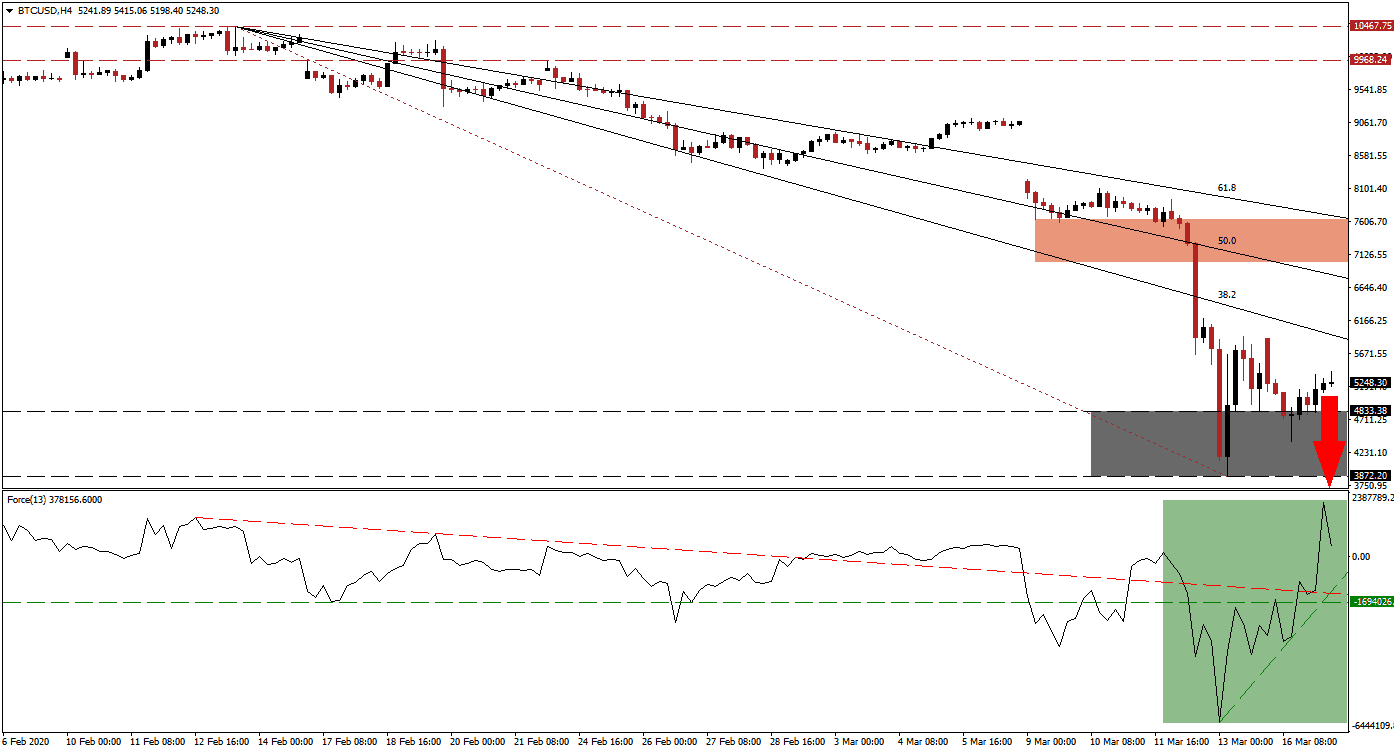
Institutional selling across the cryptocurrency sector is anticipated to continue as portfolio managers are forced to raise capital to meet margin calls. Covid-19 triggered a global sell-off, igniting a bear market across many markets with the vast majority unprepared. After the BTC/USD collapsed below the 4,000 level into its support zone, retail buyers stepped in based on bargain hunting and inspired by hopes for a quick recovery. A technical bounce was expected following the severe sell-off, but this cryptocurrency pair is vulnerable to a renewed sell-off until equity markets bottom out.
The Force Index, a next-generation technical indicator, spiked to a new multi-week high, but failed to elevate the BTC/USD significantly. It is already retreating and applying downside pressure on this cryptocurrency pair. The Force Index is building momentum to contract below its ascending support level, as marked by the green rectangle. A double breakdown, below its descending resistance level and its horizontal support level, is likely to materialize. Bears will regain control of price action after this technical indicator moves below the 0 center-line. You can learn more about the Force Index here.
Price action pushed out of its support zone located between 3,872.20 and 4,833.38, as identified by the grey rectangle, but bullish momentum is fading. Adding to downside pressure is the descending 38.2 Fibonacci Retracement Fan Resistance Level, which enforced the bearish chart pattern. With more institutional selling ahead, Bitcoin is on track to collapse to new multi-year lows. The upcoming third having event in Bitcoin in May could trigger a more massive sell-off in the BTC/USD, unlike the previous two, which inspired fresh all-time highs.
With bearish pressures mounting, the short-term resistance zone will be lowered to reflect the developing technical scenario, supported by fundamental factors. This zone is currently located between 7,254.10 and 7,636.61, as marked by the red rectangle. The 61.8 Fibonacci Retracement Fan Resistance Level has approached the top range of it, increasing breakdown pressures. While the next support zone awaits the BTC/USD between 2,970.40 and 3,290.21, an extension of the corrective phase remains a distinct possibility.
BTC/USD Technical Trading Set-Up - Breakdown Extension Scenario
Short Entry @ 5,250.00
Take Profit @ 3,000.00
Stop Loss @ 5,900.00
Downside Potential: 225,000 pips
Upside Risk: 65,000 pips
Risk/Reward Ratio: 3.46
In the event of more upside in the Force Index, ignited by its ascending support level, the BTC/USD may spike into its short-term resistance zone. The 61.8 Fibonacci Retracement Fan Resistance Level limits the upside, while fundamental circumstances deteriorate on the back of an exodus of institutional demand. Retail traders are anticipated to buy the dips, but the size of available capital as compared to professional portfolios cannot counter new selling pressure. Bitcoin mining has become unprofitable, expected to lead to a collapse in the hashrate, leading to an acceleration in the sell-off.
BTC/USD Technical Trading Set-Up - Limited Breakout Extension Scenario
Long Entry @ 6,200.00
Take Profit @ 7,500.00
Stop Loss @ 5,650.00
Upside Potential: 130,000 pips
Downside Risk: 55,000 pips
Risk/Reward Ratio: 2.36

