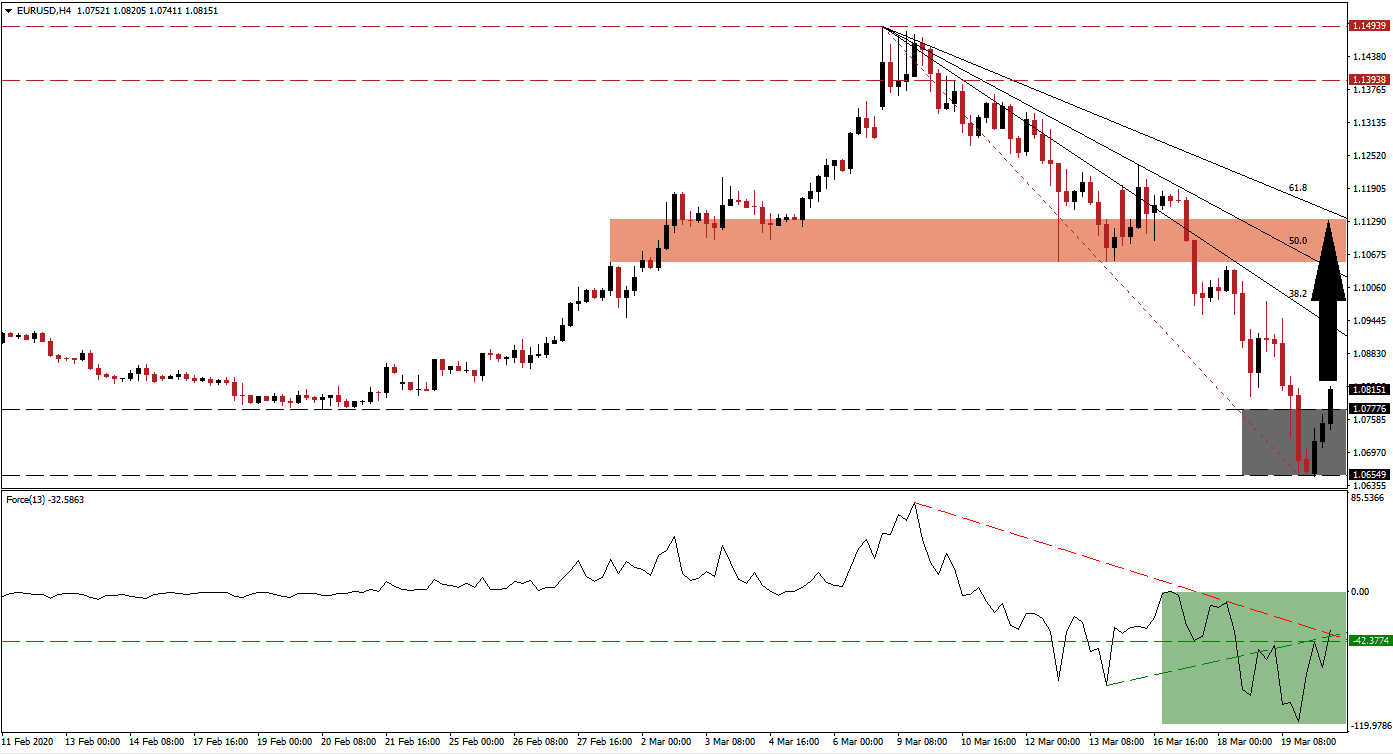
Due to the financial meltdown in response to Covid-19, a liquidity crunch forced inflows into the US Dollar, providing a short-term boost to price action. Central banks have slashed interest rates and announced trillions worth of capital while governments announced economic rescue packages with more being prepared. The situation is taking a more excessive shape than that of the 2008 global financial crisis, but central banks operate with a near-depleted arsenal. After the EUR/USD was forced into its support zone, bullish momentum started to recover, creating conditions for a short-covering rally.
The Force Index, a next-generation technical indicator, initially fell to a new 2020 low and verified the collapse in this currency pair. It has now reversed and is on the verge of confirming a triple breakout. The Force Index converted its horizontal resistance level into support, followed by a breakout above its descending resistance level, and reclaiming its ascending support level, as marked by the green rectangle. This technical indicator remains below the 0 center-line but is positioned to accelerate into positive territory, placing bulls in control of the EUR/USD.
While the US Federal Reserve diminished its interest rate to 0.00% and restarted quantitative easing, the European Central Bank kept its key benchmark interest rate unchanged. It announced a reduction in the rate it charges banks to borrow from it to -0.75%, essentially paying banks to take capital and loan it to businesses and consumers, representing a carry trade. The quantitative easing program in place since November 2019 was boosted to €750 billion, allowing the EUR/USD to halt its sell-off inside the support zone located between 1.06549 and 1.07776, as marked by the grey rectangle.
A breakout in the EUR/USD is in the process of materializing, favored sparking a short-covering rally off of extreme oversold conditions, closing the gap to its descending 38.2 Fibonacci Retracement Fan Resistance Level. An extension into its short-term resistance zone located between 1.10527 and 1.11334, as marked by the red rectangle, enforced by its 61.8 Fibonacci Retracement Fan Resistance Level, is anticipated to follow. US economic data has started to show extreme weakness, expected to increase over the coming month, adding a distinct bearish bias to the US Dollar. You can learn more about a breakout here.
EUR/USD Technical Trading Set-Up - Short-Covering Scenario
Long Entry @ 1.08100
Take Profit @ 1.11300
Stop Loss @ 1.07200
Upside Potential: 320 pips
Downside Risk: 90 pips
Risk/Reward Ratio: 3.56
A contraction in the Force Index, enhanced by its descending resistance level, which currently acts as temporary support, may result in a spike in breakdown pressures in the EUR/USD. The next support zone awaits price action between 1.03373 and 1.04516, dating back to January 2017. More downside is unlikely unless fundamental conditions present a material change, with renewed risks of a costly Eurozone break-up on the rise.
EUR/USD Technical Trading Set-Up - Breakdown Scenario
Short Entry @ 1.05850
Take Profit @ 1.03850
Stop Loss @ 1.06850
Downside Potential: 200 pips
Upside Risk: 100 pips
Risk/Reward Ratio: 2.00

