The difference between success and failure in Forex trading is very likely to depend upon which currency pairs you choose to trade each week, and not on the exact trading methods you might use to determine trade entries and exits. Of course, the current market environment is one of crisis and very high volatility, and price movements are entirely dominated by the economic impact of the coronavirus pandemic. That is the dominant factor to consider in trading any market today.
Big Picture 29th March 2020
In my previous piece last week, I forecasted that the best trades were likely to be short S&P 500 Index, WTI Crude Oil, and the EUR/USD currency pair. Over the week, the S&P 500 Index rose in value by 11.05%, WTI Crude Oil fell by 6.84%, and the EUR/USD currency pair rose by 4.06%, so the average loss here was 2.76%.
Last week’s Forex market saw the strongest rise in the relative value of the U.S. Dollar, and the strongest fall in the relative value of the Australian Dollar.
Fundamental Analysis & Market Sentiment
The world is not coming to an end, but we are living in an extraordinary time of global health crisis, the type of which has not been seen in one hundred years. There is a great deal of fear and panic, but it is important to remember that the evidence shows that the vast majority of people are going to be OK.
In time such as these, it is extremely difficult to make very short-term market forecasts, as the crisis can change focus day by day, strongly affecting sentiment and market movements. However, medium-term forecasts are easier to make as high levels of volatility tend to accompany see-sawing price movement.
We have seen the epicenter of the global pandemic move into Europe and the United States, with new confirmed infections and deaths rising exponentially in Catalonia, New York, Paris and London.
All stock markets are now in technical bear markets (decline of more than 20% from peak). However, many markets, especially the U.S., have seen firm recoveries this week. The U.S. stock market has been boosted by a $2.2 trillion emergency stimulus package, but this has weakened the Dollar as it is effectively printing a lot of new currency and devaluing the currency. Nevertheless, this is likely to be a fake rally, as the data suggests the daily death toll will continue to rise exponentially in the U.S. while much of the population, punditry and politicians remain in a state of denial concerning the severity of the crisis.
It is clear that this crisis will enforce severe economic restrictions in all affected countries which will need to last for several weeks or even months. The only given is that stock markets and GDP generally will take severe hits, with Goldman Sachs now forecasting a 24% drop in U.S. GDP. We have already seen emergency rate cuts in several countries and there may be even more ahead. The stock market crash we are seeing is comparable to 2008 and even 1929 so far. In fact, the speed of the initial drop of 20% from the all-time high price took only 15 market days to happen, compared to 30 days in 1929.
It seems clear that we will see a continued level of high market volatility. Prices are likely to depend upon how the U.S.A. and European nations cope with the spread of the virus, and whether there are any signs of successful containment as we seem to have seen in China, South Korea, Singapore, and Hong Kong. There is some good news – the rate of increase in confirmed new infections has slowed down in Italy. It should be remembered that deaths tend to log new infections by approximately 3 weeks.
Technical Analysis
U.S. Dollar Index
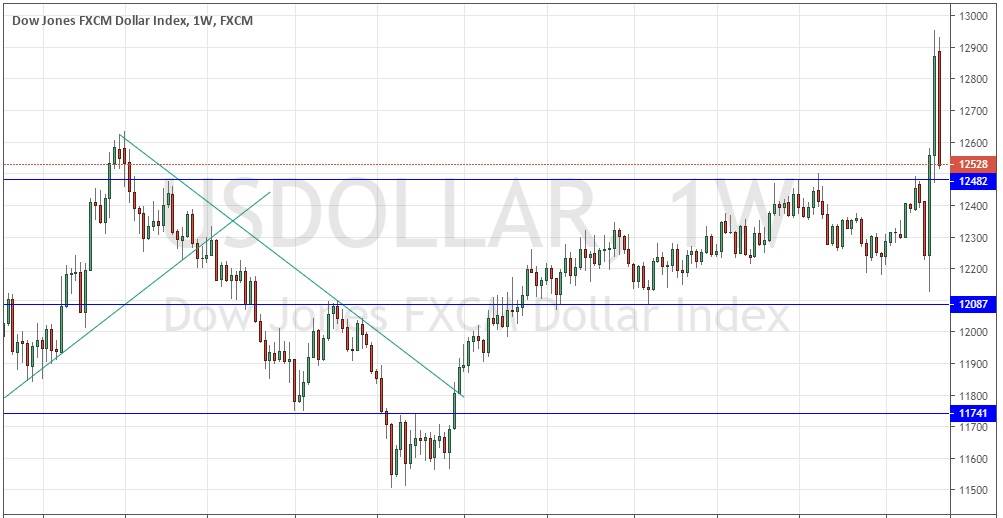
The weekly price chart below shows last week printed a very large bearish candlestick which closed very close to the low of its range. It made a very strong counter-trend movement after reaching a new 17-year high price last week on extremely high volatility. This is actually a bullish sign, as a bounce back in the direction of the long-term trend is likely to occur over the coming week. However, the U.S. stimulus package which has just been agreed has probably devalued the fair value of the U.S. Dollar. Overall, it seems likely that the U.S. Dollar will rise over the coming week.
S&P 500 Index
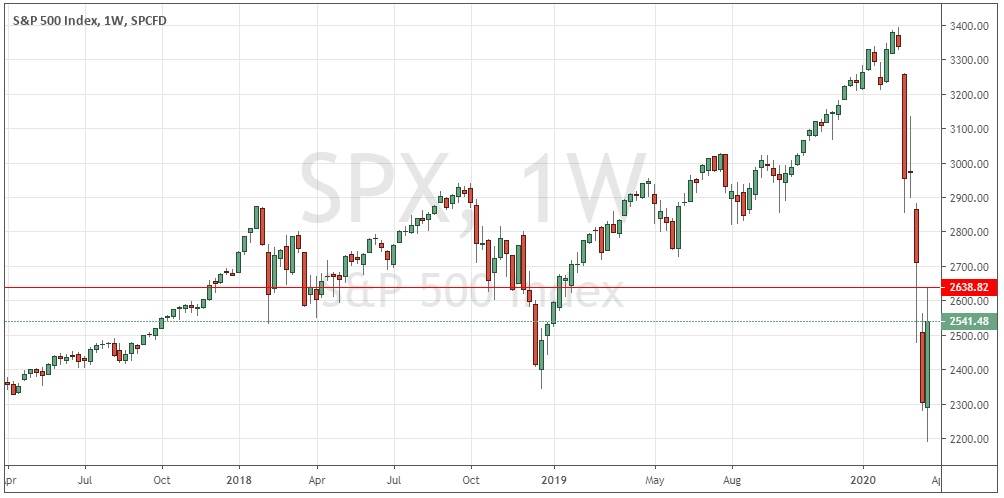
The major U.S. stock market index – the biggest market index in the world – made its strongest weekly rise in decades after closing at its lowest weekly close in three years last week. We saw this bullish bounce due to the U.S. agreeing a new bullish bounce when the U.S. administration and congress $2 trillion stimulus and bailout package, but the worsening, Great Depression-like situation regarding demand and output means that such a bullish retracements is almost certainly going to be a good selling opportunities for the coming week. We are unlikely to have seen the bottom of this bear market yet.
WTI Crude Oil
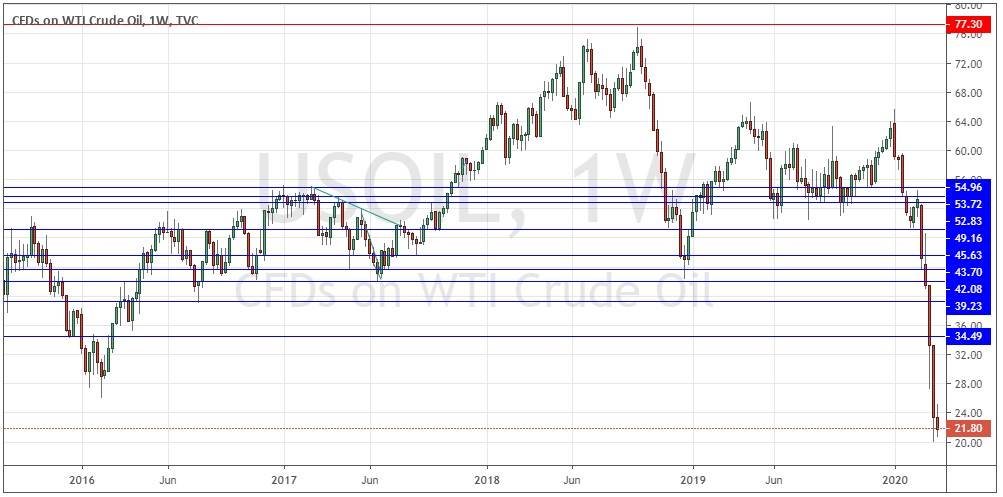
WTI Crude Oil again fell in value and ended at its lowest weekly close in 18 years. The the worsening, Great Depression-like situation regarding demand and output globally, and not just in the U.S., means that we are most likely to see another fall over the coming week. Bears should keep in mind that the $20 level close to the current price may act as support, at least for a while.
Conclusion
This week I forecast the best trades are likely to be short of the S&P 500 Index and WTI Crude Oil.


