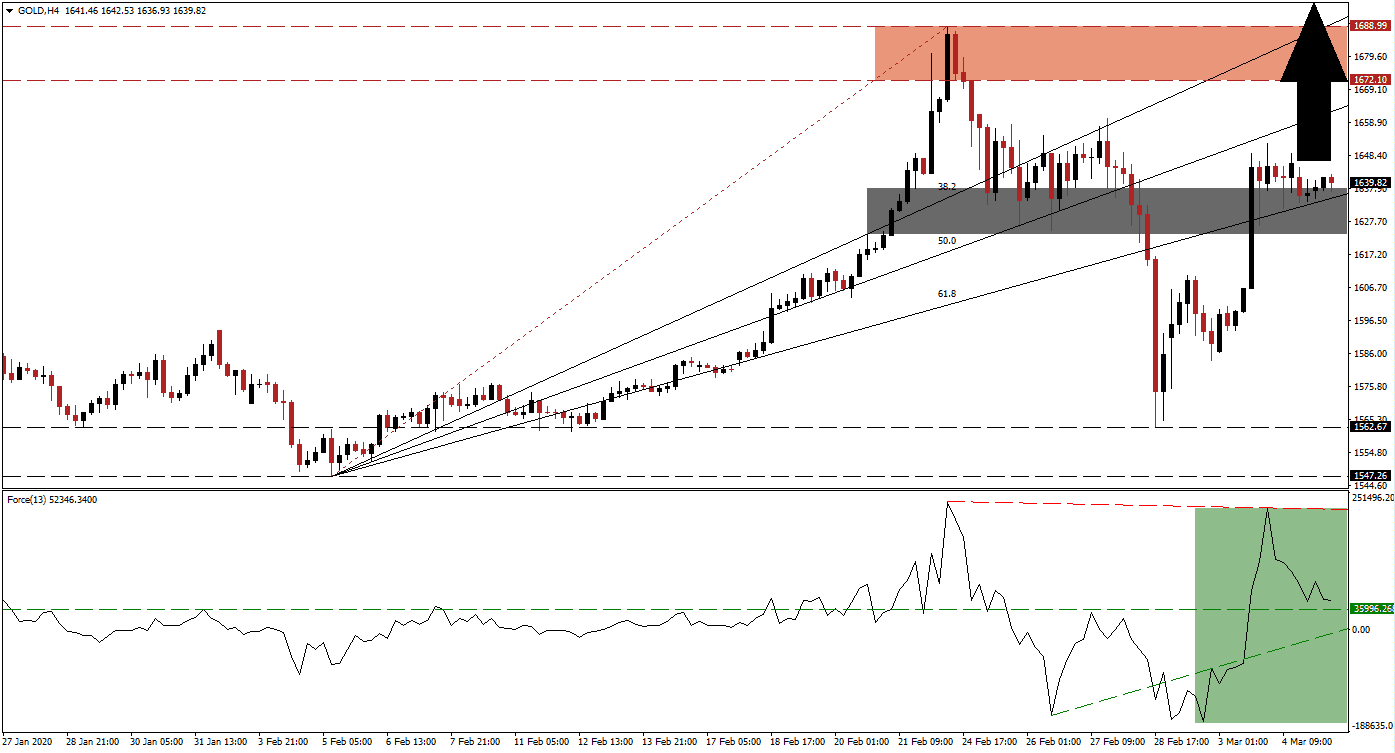
This precious metal was caught in a correlation sell-off with the rest of the financial system. Portfolio managers were forced to exit positions and close hedges to meet capital requirements and satisfy margin calls last week. The dominant bullish trend prevailed after the US Federal Reserve panicked and slashed interest rates by 50 basis points earlier this week. Last week’s sell-off in gold briefly grazed the top range of its long-term support zone, creating a higher low, confirming the existence of a bullish chart pattern.
The Force Index, a next-generation technical indicator, offered an early indicator that last week’s sell-off will be short-lived after a positive divergence materialized. The Force Index spiked above its horizontal resistance level, converting it into support, but reversed from a marginally lower high. Bulls remain in charge of gold after the emergence of a descending resistance level. This technical indicator is approaching its converted horizontal support level in positive territory, as marked by the green rectangle, from where more upside is favored. You can learn more about the Force Index here.
After gold recovered from its contraction, it additionally eclipsed its ascending 61.8 Fibonacci Retracement Fan Resistance Level, turning it into support. It is currently passing through the short-term support zone located between 1,623.64 and 1,638.05, as marked by the grey rectangle. Bullish momentum sufficed to pressure price action above this zone, and the Fibonacci Retracement Fan sequence is anticipated to guide this precious metal farther to the upside. Safe-haven demand related to Covid-19 combined with central bank panic provides a solid long-term fundamental catalyst.
One critical level to monitor is the intra-day high of 1,652.25, the peak of the recovery. A breakout above it is expected to attract new net buy orders in gold, providing fuel to the advance. Price action is well-positioned to challenge its resistance zone located between 1,672.10 and 1,688.99, as marked by the red rectangle. With the 38.2 Fibonacci Retracement Fan Resistance Level already above this zone, a breakout extension is likely. The next resistance zone awaits this precious metal between 1,772.52 and 1,795.25, dating back to September 2012.
Gold Technical Trading Set-Up - Breakout Extension Scenario
Long Entry @ 1,639.75
Take Profit @ 1,795.25
Stop Loss @ 1,604.75
Upside Potential: 15,550 pips
Downside Risk: 3,500 pips
Risk/Reward Ratio: 4.44
In case of a contraction in the Force Index below its ascending support level, gold is anticipated to enter a minor corrective phase. With the dominant bearish outlook for the global economy for 2020, the downside potential for this precious metal remains limited to its long-term support zone between 1,547.26 and 1,562.67. Traders are advised to consider this an excellent buying opportunity.
Gold Technical Trading Set-Up - Limited Breakdown Scenario
Short Entry @ 1,592.00
Take Profit @ 1,562.50
Stop Loss @ 1,606.50
Downside Potential: 2,950 pips
Upside Risk: 1,450 pips
Risk/Reward Ratio: 2.03

