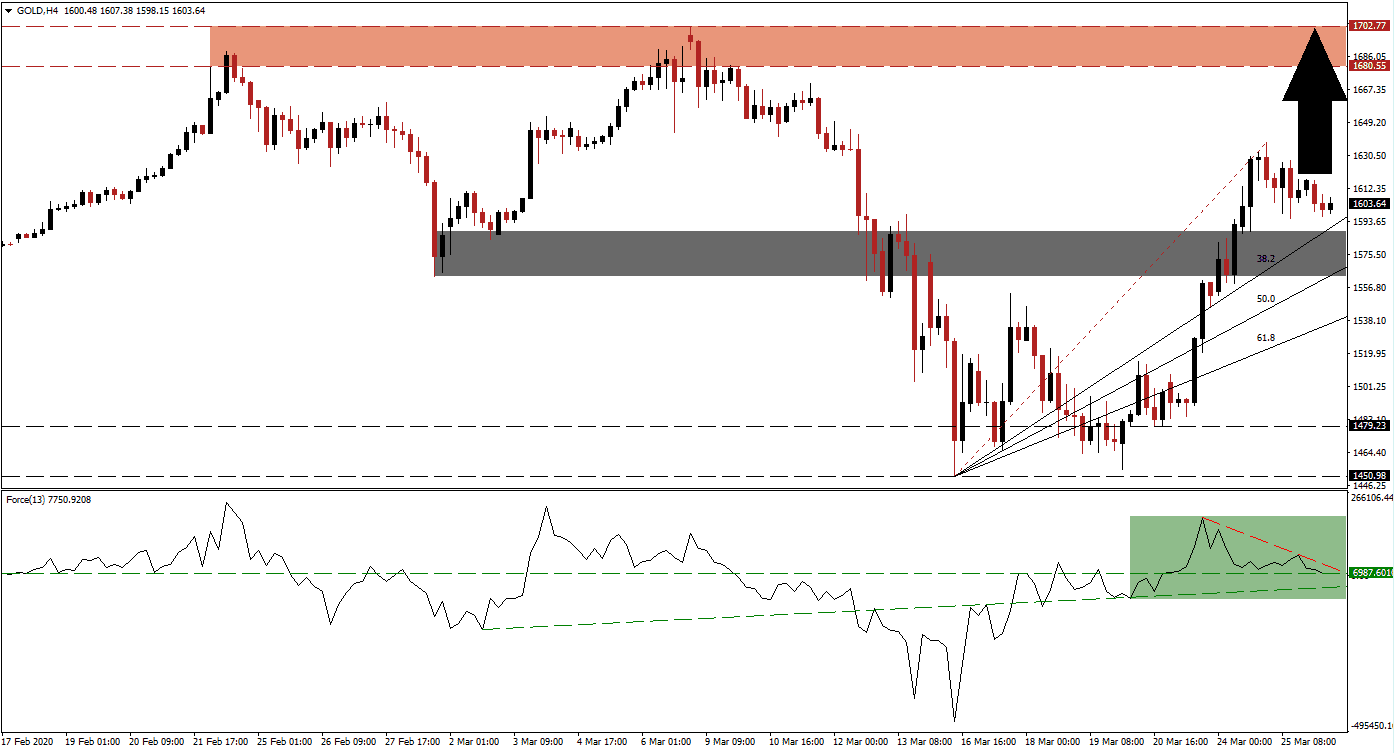
Global Covid-19 cases are approaching 500,000, and the economy is on track to enter a recession. After the US announced a $2 trillion stimulus, and with the US Federal Reserve flooding the market with US Dollars, safe-haven assets like gold received a bullish catalyst. Gold and the US currency have enjoyed an inverse relationship, which is expected to continue. This precious metal was caught in the selling vortex across the global financial system, as fund managers were forced to liquidate positions to satisfy margin calls. Selling pressure abated, and price action is positioned to extend its breakout.
The Force Index, a next-generation technical indicator, confirms the presence of expanding bullish momentum. After gold plunged to a new 2020 low, the Force Index quickly reversed above its ascending support level. It then converted its horizontal resistance level into support, as marked by the green rectangle. This technical indicator is drifting lower from its peak, guided to the downside by its descending resistance level, but remains above the 0 center-line, with bulls in charge of this precious metal.
Governments announced significant economic rescue packages. The US added corporate bailouts similar to the aftermath of the 2008 global financial crisis. In the second half of 2020, the attention will shift to the amount of new debt in a recessionary environment. It creates ideal conditions for gold to drive to new 2020 year highs. Price action already pushed out of its short-term support zone located between 1,562.67 and 1,587.91, as marked by the grey rectangle. The re-drawn Fibonacci Retracement Fan sequence is adding to upside pressure.
One essential level to monitor is the intra-day high of 1,638.05, the peak of the current breakout sequence, and the end-point of the Fibonacci Retracement Fan. A breakout is favored to invite new net buy orders into this precious metal, providing the necessary volume to pressure gold into its long-term resistance zone. This zone is located between 1,680.55 and 1,702.77, as identified by the red rectangle. More upside is anticipated, on the back of a pending global recession. Excessive record debt levels and a potential spike in inflation post-Covid-19 are adding to fundamental momentum. You can learn more about a resistance zone here.
Gold Technical Trading Set-Up - Breakout Extension Scenario
Long Entry @ 1,602.75
Take Profit @ 1,702.75
Stop Loss @ 1,575.00
Upside Potential: 10,000 pips
Downside Risk: 2,775 pips
Risk/Reward Ratio: 3.60
A collapse in the Force Index below its ascending support level and into negative territory is anticipated to pressure gold into a breakdown. The downside potential is limited to the ascending 61.8 Fibonacci Retracement Fan Support Level, which will present traders with an outstanding buying opportunity. Volatility is expected to remain elevated, but the overall outlook is increasingly bullish.
Gold Technical Trading Set-Up - Limited Breakdown Scenario
Short Entry @ 1,560.00
Take Profit @ 1,540.00
Stop Loss @ 1,570.00
Downside Potential: 2,000 pips
Upside Risk: 1,000 pips
Risk/Reward Ratio: 2.00

