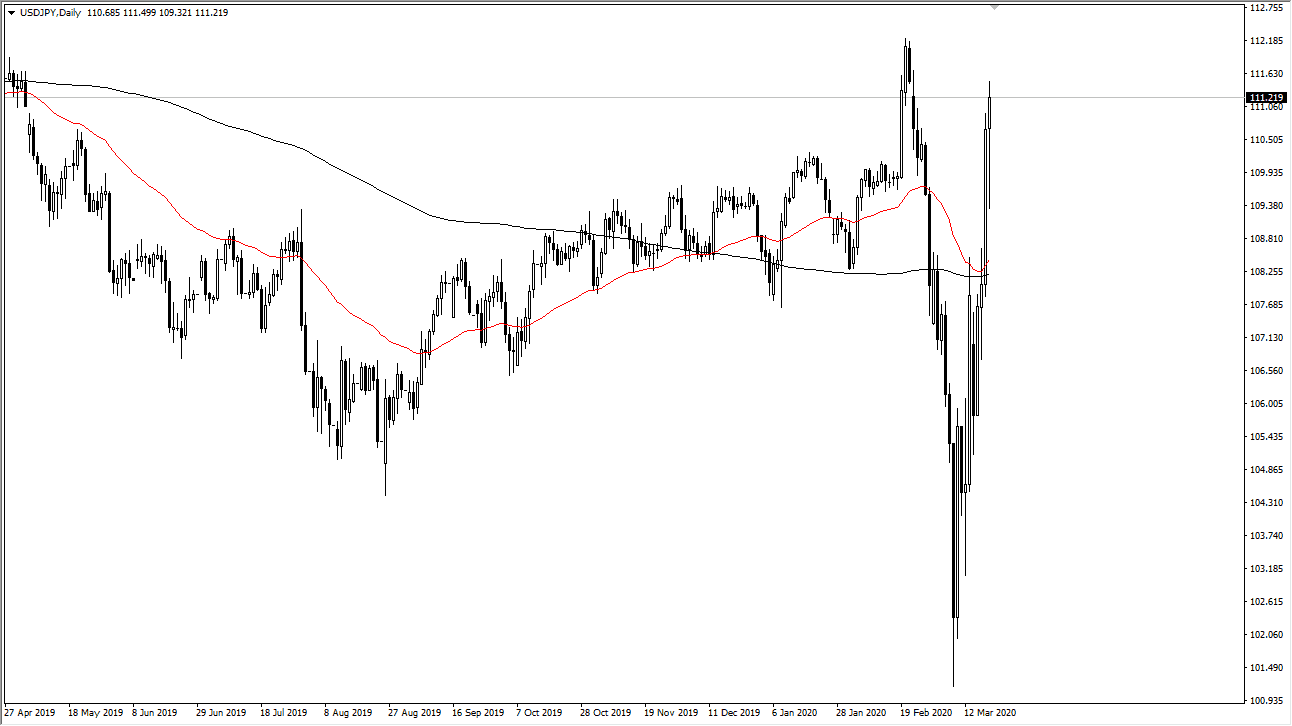
The US dollar initially fell during the trading session on Friday but found enough support underneath the turn things around and show signs of life. By going so, we did up forming a bit of a hammer shaped candlestick, which could lead to further buying, but if we break down below the bottom of the candlestick, then it’s likely that the market will break down as it will suddenly become a “hanging man.”
Looking at this chart, if we break down below the bottom of that “hanging man”, then I think the market goes looking towards the 200 day EMA closer to the ¥108 level. At this point, one has to wonder whether or not we are at the top of a range, or if we are actually trying to break out. It would be difficult to break out without some type of shock run towards the US dollar yet again, as some type of bad news could make that in fact happen. However, I believe that the market is more or less getting overstretched, but it is possible that if the market does get more of a shock announcement, that could be what since the USD/JPY pair above the ¥112 level.
To the downside, the bottom of the overall range extends down to the ¥102 level, but overall, this is a market that is going to continue to see a lot of noise and volatility so keep that in mind please. I would keep my position size very small and aim for wider swings. If we do break above the ¥112 level on a daily close, then it’s very likely that we go looking towards the ¥114 level, followed by the ¥115 level. Otherwise, it’s very likely that we do rollover simply because we should run out of momentum. A lot can happen over the weekend obviously, and that could greatly influence how we kick off the week on Monday. This chart is a strong sign of what we are dealing with the overall when it comes to markets, as we have suddenly seen an explosion of volatility. Because of this, be very cautious and only trade as we get to the outer reaches of the ranges on the chart, because quite frankly anything in the middle is going to be gambling. If you see this market rising or falling, you may do better off trading another currency against the yen and using this chart as an indicator.


