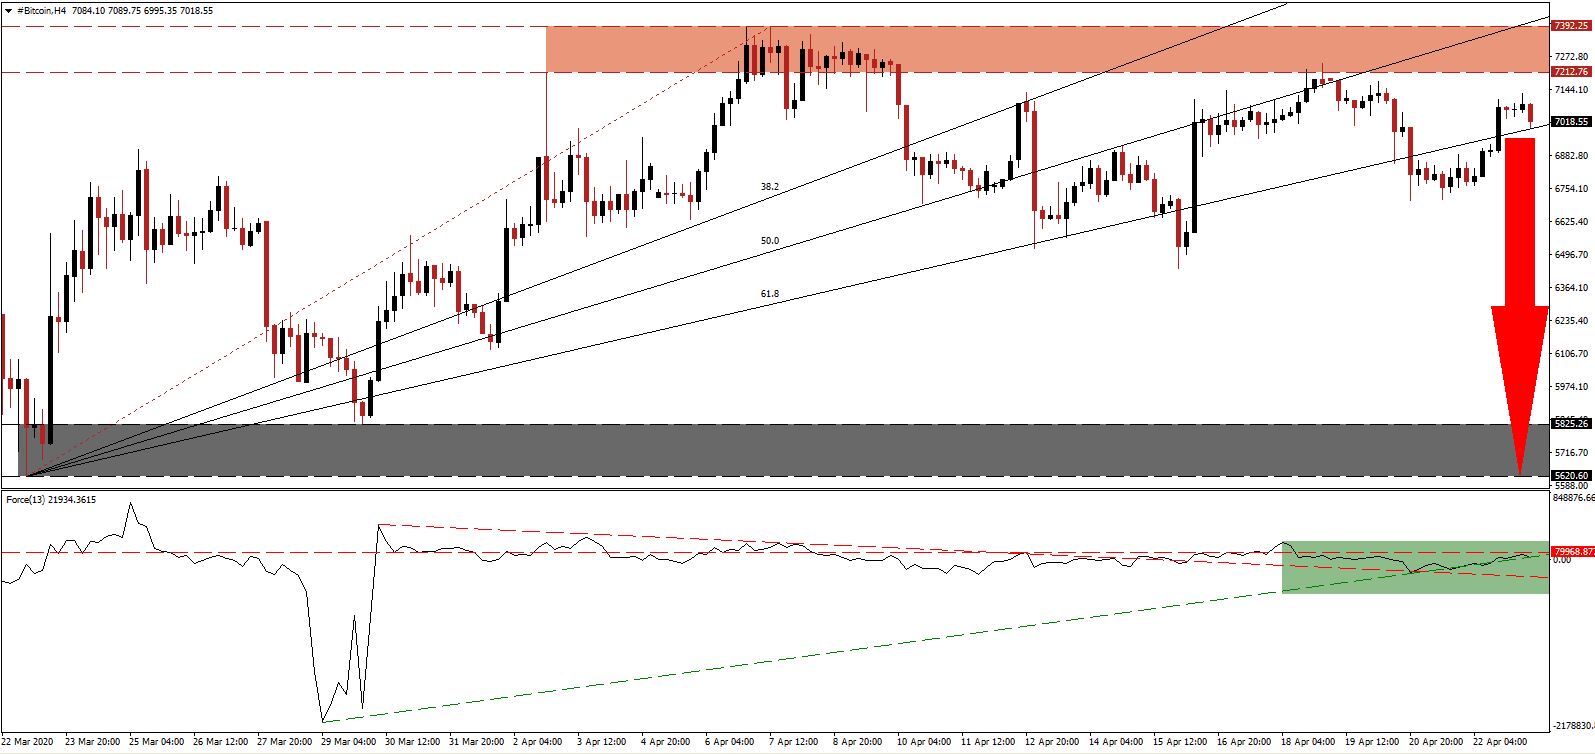
Bitcoin will face its third-having event on May 12th. Enthusiasts hoping for a repeat of the previous two, which initiated massive rallies to new all-time highs, are well-positioned for a disappointment. Mining profitability at current levels is depressed. The hashrate collapsed with the first wave of selling related to institutional investors dumping non-core assets, and in 19 days, mining rewards will be slashed by 50%. It may force more miners to idle operations, applying downside pressure on the BTC/USD. A new wave of selling cannot be excluded, making price action vulnerable to a profit-taking sell-off on the back of accumulation in breakdown pressures.
The Force Index, a next-generation technical indicator, was able to use the crossover of its ascending support level and descending resistance level to drift higher, as marked by the green rectangle. It remains in positive territory below its horizontal resistance level and is on the verge to correct below its ascending support level, converting it into resistance. This technical indicator is additionally favored to collapse below the 0 center-line, granting bears full control of the BTC/USD.
Following the exit of the ascending 38.2 and 50.0 Fibonacci Retracement Fan Resistance Levels above the resistance zone, this cryptocurrency pair came under an additional spike in bearish momentum. This zone, located between 7,212.76 and 7,392.25, as marked by the red rectangle, rejected the BTC/USD on three occasions. It represents a significant obstacle for price action, and in combination with dominant fundamental conditions, a more massive correction phase is anticipated to materialize.
Adding to the negative development is the absence of mass-adoption by the corporate sector. While the argument of value storage is relevant, the lack of interest by companies provides a long-term fundamental catalyst. The BTC/USD is expected to enter a corrective phase until it challenges its support zone located between 5,620.60 and 5,825.26, as identified by the grey rectangle. After a breakdown below its 61.8 Fibonacci Retracement Fan Resistance Level, the intra-day low of 6,440.75, the base of a previously reversed contraction, will provide a temporary support level on the way to the downside. You can learn more about a breakdown here.
BTC/USD Technical Trading Set-Up - Breakdown Scenario
Short Entry @ 7,015.00
Take Profit @ 5,685.00
Stop Loss @ 7,415.00
Downside Potential: 133,000 pips
Upside Risk: 30,000 pips
Risk/Reward Ratio: 4.43
A bounce higher in the Force Index, off of its ascending support level, could pressure the BTC/USD into a temporary breakout. Volatility is favored to increase as the third having event approaches. Traders are advised to consider a price spike from current levels as an excellent selling opportunity, with downside risks increasingly dominant. The next resistance zone awaits price action between 8,120.25 and 8,395.85.
BTC/USD Technical Trading Set-Up - Limited Breakout Scenario
Long Entry @ 7,665.00
Take Profit @ 8,365.00
Stop Loss @ 7,415.00
Upside Potential: 70,000 pips
Downside Risk: 25,000 pips
Risk/Reward Ratio: 2.80

