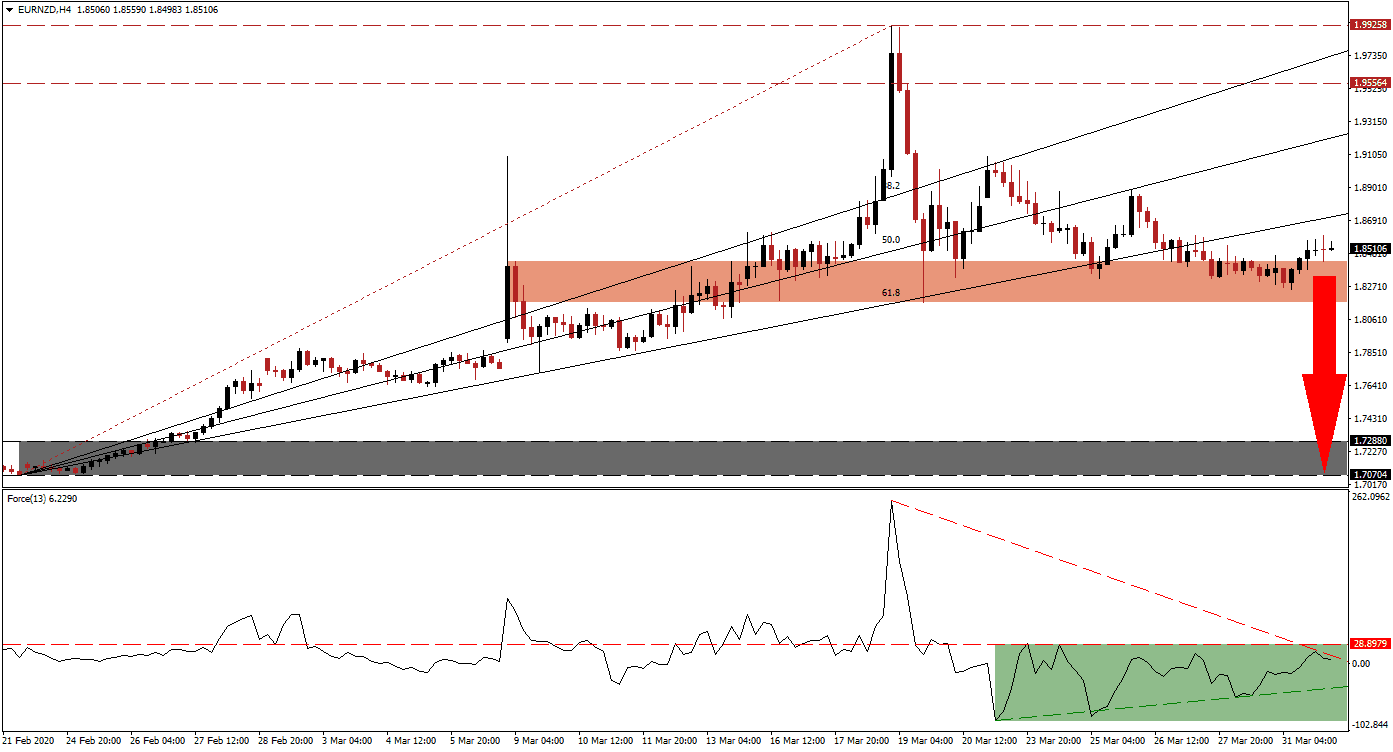
New Zealand started planning for a post-Covid-19 economy. Finance Minister Robertson notes the country will require a massive nation-building program of infrastructure and public works to lift the economy out of a deep recession. Over 200,000 job losses may result from the global pandemic, and he adds more stimulus will be required after the NZ$12.1 billion was announced. The EUR/NZD established a bearish chart pattern through a series of lower highs, which makes price action vulnerable to a renewed breakdown.
The Force Index, a next-generation technical indicator, collapsed from a 2020 peak to a new annual low. It converted its horizontal support level into resistance before creating three higher lows, allowing for an ascending support level to materialize. The Force Index was rejected by its horizontal resistance level and is now being pressured lower by its descending resistance level, as marked by the green rectangle. Bears are anticipated to regain control of the EUR/NZD after this technical indicator moves below the 0 center-line.
This currency pair pushed above its short-term resistance zone located between 1.81722 and 1.84281, as identified by the red rectangle. It is now trapped above the top range and the ascending 61.8 Fibonacci Retracement Fan Resistance Level. The New Zealand government passed an NZ$52 billion Imprest Supply Bill, covering the second quarter, or twice the average annual budget. The country is also rethinking its domestic economy, with Deputy Prime Minister Winston Peters noting it has a chance to emerge wealthier than before. With New Zealand taking a proactive role in fighting Covid-19, while additionally planning for the future, the EUR/NZD is positioned to enter a more massive correction.
Chinese PMI data released during the Asian trading session showed once again, the manufacturing sector expanded in March, defying calls for a contraction. The added bullish momentum for the New Zealand Dollar from Chinese economic strength is favored to result in a breakdown in the EUR/NZD below its short-term resistance zone. It will clear the path for price action to accelerate into its support zone located between 1.70704 and 1.72880, as marked by the grey rectangle. You can learn more about a support and resistance zone here.
EUR/NZD Technical Trading Set-Up - Breakdown Scenario
Short Entry @ 1.85100
Take Profit @ 1.70700
Stop Loss @ 1.88000
Downside Potential: 1,440 pips
Upside Risk: 290 pips
Risk/Reward Ratio: 4.97
A breakout in the Force Index above its descending resistance level could inspire the EUR/NZD to convert its 61.8 Fibonacci Retracement Fan Resistance Level into support. Any potential advance is likely to remain short-lived due to the Eurozone’s inability to mount a unified approach to prepare the region for sustained growth. Forex traders are recommended to consider a push into its resistance zone located between 1.95564 and 1.99258 as an excellent short-selling opportunity.
EUR/NZD Technical Trading Set-Up - Limited Breakout Scenario
Long Entry @ 1.91500
Take Profit @ 1.97300
Stop Loss @ 1.88700
Upside Potential: 580 pips
Downside Risk: 280 pips
Risk/Reward Ratio: 2.07


