A recent poll revealed that almost 50% of surveyed economists believe the US will enjoy a U-shaped recovery sooner than expected, as the country appears to pass the peak of the global Covid-19 pandemic. The questionnaire was sent out before the collapse of the oil price and highlighted the lag at which they operate. Analysts have cut the growth outlook of the US, the Federal Reserve is likely to expand its balance sheet to over $10 trillion, and permanent damage is not priced into the markets. The energy sector is on the verge of bankruptcy filings and job cuts, adding pressure to the already strained labor market. With the Eurozone facing existential issues, the EUR/USD is favored to be limited to its dominant trading range, with a pending breakout likely to take it to the top range of it.
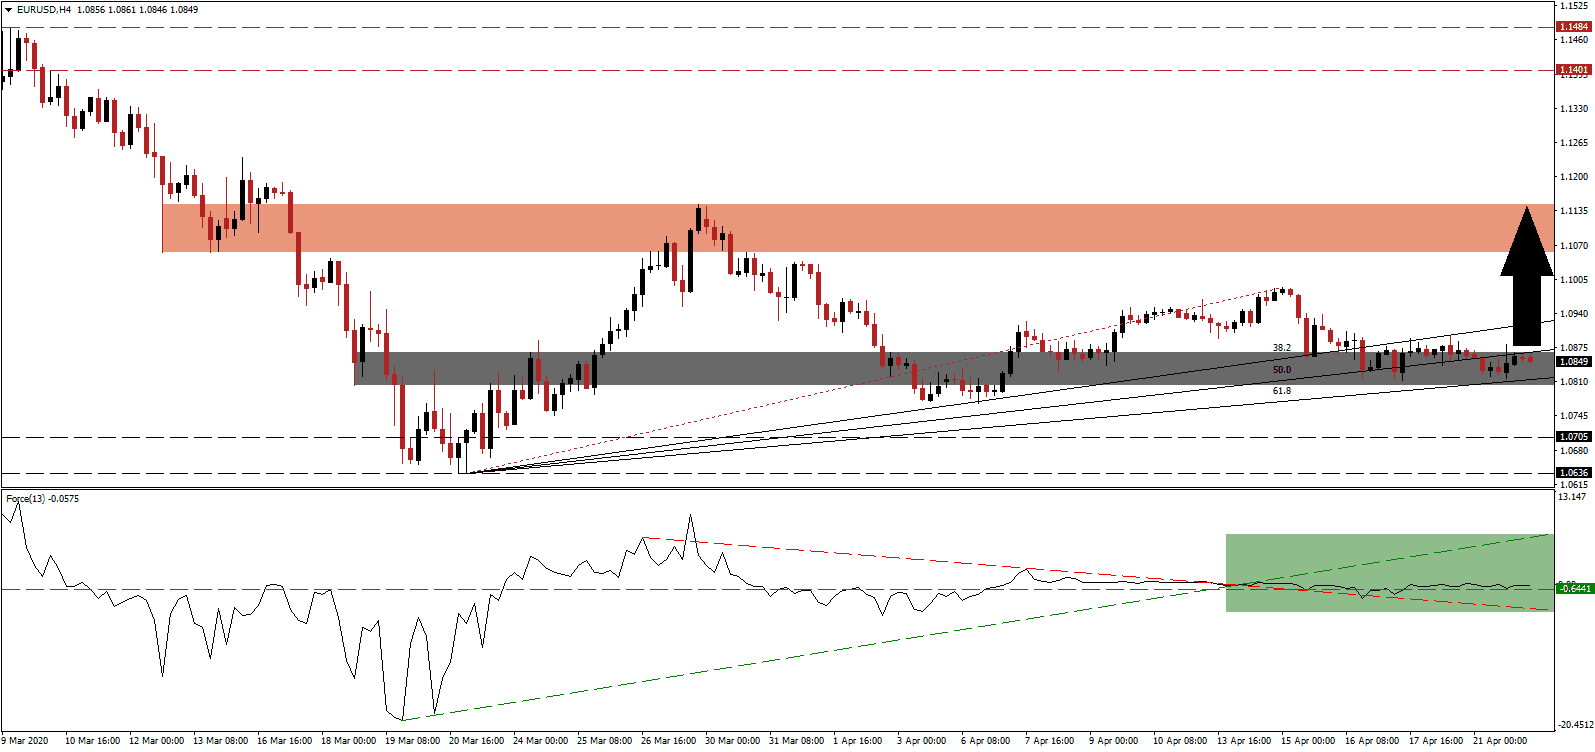
The Force Index, a next-generation technical indicator, remains above its horizontal support level in negative territory, as marked by the green rectangle. A sideways trend left it below its ascending support level and above its descending resistance level. The reversal of both is not sustainable, resulting in pressures for the Force Index to reclaim either one. This technical indicator is positioned to drift above the 0 center-line, ceding control of the EUR/USD to bulls.
Price action awaits the next catalyst inside of its short-term support zone located between 1.0802 and 1.0866, as marked by the grey rectangle, enforced by its ascending 61.8 Fibonacci Retracement Fan Support Level. Three higher lows authenticated a bullish bias in the EUR/USD, anticipated to push this currency pair to the upside. Sentiment indicators are on the rise, while countries across Europe initiated partial resumption of economic activities. Restrictions and safety measures are in place.
Forex traders are advised to monitor the intra-day high of 1.0990, the peak of the current breakout above its short-term support zone, and the end-point of the redrawn Fibonacci Retracement Fan sequence. A move above this level will extend the pending advance in the EUR/USD into its short-term resistance zone located between 1.1055 and 1.1147, as identified by the red rectangle. More upside is possible but requires a new catalyst. You can learn more about the support and resistance zone here.
EUR/USD Technical Trading Set-Up - Breakout Scenario
Long Entry @ 1.0850
Take Profit @ 1.1145
Stop Loss @ 1.0760
Upside Potential: 295 pips
Downside Risk: 90 pips
Risk/Reward Ratio: 3.28
In the event the Force Index collapses below its descending resistance level, acting as support, the EUR/USD may be pressured into a correction. The downside potential is confined to the long-term support zone between 1.0636 and 1.0705, given existing fundamentals and weakening US growth outlook. Forex traders are recommended to consider this an excellent buying opportunity due to the rising debt level in the US in combination with misplaced optimism about the post-Covid-19 recovery.
EUR/USD Technical Trading Set-Up - Limited Breakdown Scenario
Short Entry @ 1.0720
Take Profit @ 1.0640
Stop Loss @ 1.0760
Downside Potential: 80 pips
Upside Risk: 40 pips
Risk/Reward Ratio: 2.00


