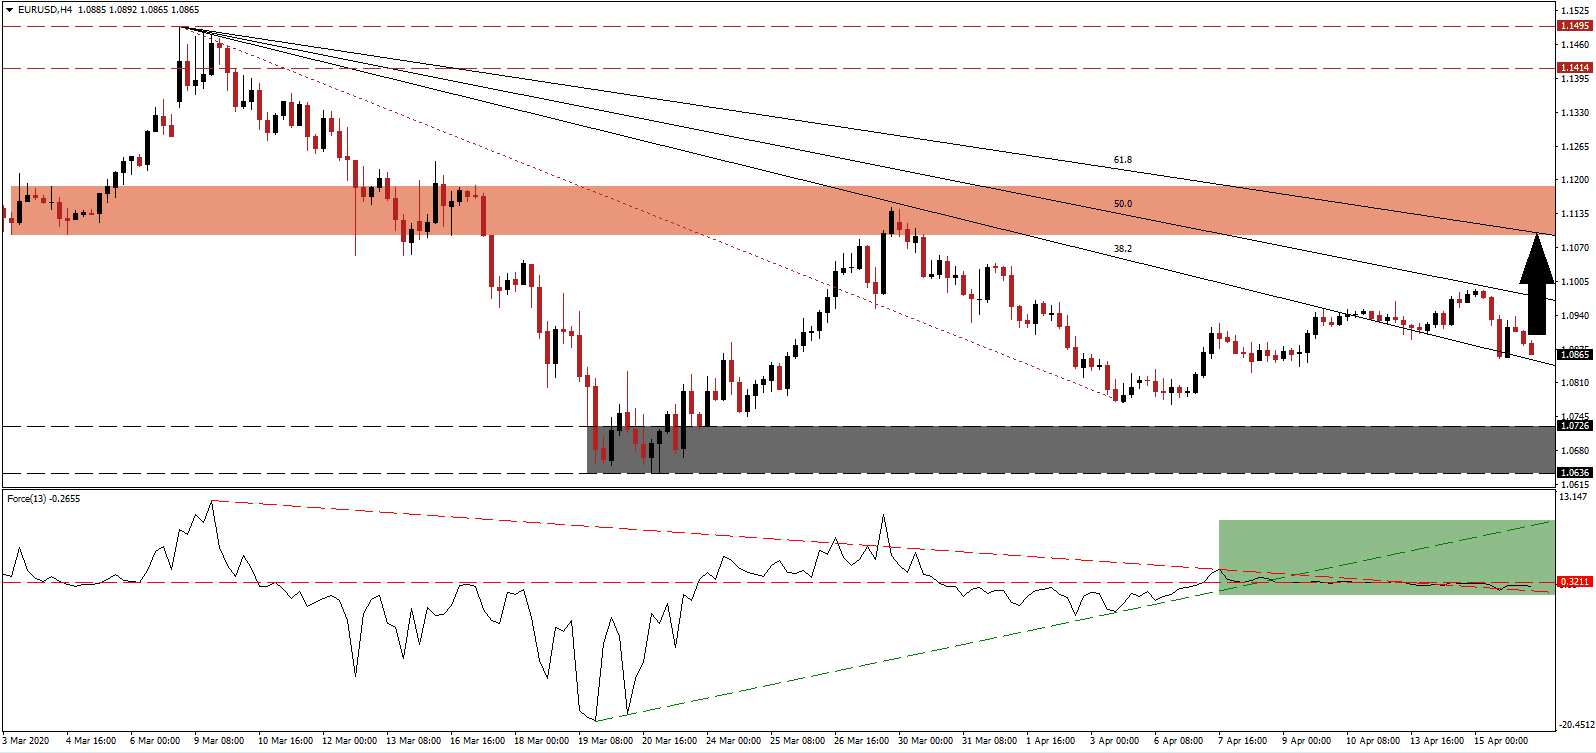
After a series of failed meetings between Eurozone finance ministers, highlighting deep divisions, and lack of unity within the currency union, a €540 billion bailout fund was agreed on. It consists of €100 billion for unemployment benefits, €200 billion for small business loans, and €240 in loans from the European Stability Mechanism (ESM) fund. Italy was quick to reject the ESM component, labeling it a Trojan Horse to install a Troika of EU Commissars in sovereign governments to manage economies, referring to it as collective suicide and a trap. It suggests more severe long-term structural issues, but over the short-term, the focus remains on US economic data, which has been weaker than the most pessimistic forecasts. The EUR/USD is likely to be confined to a trading range but developed a bullish chart pattern favored to elevate price action into its short-term resistance zone.
The Force Index, a next-generation technical indicator, started to essentially flatline after reversing off of its ascending support level. A lower high pressured it below its horizontal resistance level. The Force Index eclipsed its descending resistance level, as marked by the green rectangle, which now acts as a temporary support. Neither bullish nor bearish forces are dominant, but this technical indicator is expected to drift above the 0 center-line, placing bulls in control of the EUR/USD for a drift into the top of its established trading range.
US initial jobless claims data will dictate price action today. They have consistently surpassed expectations, mirrored by the NFP report for March. The past three weeks saw 16.8 million claims, roughly 10% of the workforce, filed. Another disappointment is possible with today's expectations calling for an additional five million-plus applications. After the EUR/USD completed a breakout above its support zone located between 1.0636 and 1.0726, as marked by the grey rectangle, the subsequent sell-off resulted in a higher low, adding a minor bullish bias.
With the descending Fibonacci Retracement Fan sequence enforcing the long-term downtrend, the EUR/USD is positioned to advance into its 61.8 Fibonacci Retracement Fan Resistance Level before reversing to confront its support zone again. It is on the verge of crossing below its short-term resistance zone located between 1.1095 and 1.1187, as identified by the red rectangle. Given structural issues in both economies, the present trading range is favored to remain intact.
EUR/USD Technical Trading Set-Up - Reduced Upside Scenario
Long Entry @ 1.0865
Take Profit @ 1.1095
Stop Loss @ 1.0800
Upside Potential: 230 pips
Downside Risk: 65 pips
Risk/Reward Ratio: 3.54
In the event of a breakdown in the Force Index below its descending resistance level, the EUR/USD is expected to correct into its support zone. While the outlook for the Eurozone long-term remains notably bearish, it manages a trade surplus. In comparison, the US is running a massive twin deficit. The chances of a debt crisis more excessive than in 2015 remain elevated, but the US is faced with intensive existential financial problems. Forex traders are advised to monitor the established trading range closely.
EUR/USD Technical Trading Set-Up - Limited Breakdown Scenario
Short Entry @ 1.0765
Take Profit @ 1.0635
Stop Loss @ 1.0830
Downside Potential: 130 pips
Upside Risk: 65 pips
Risk/Reward Ratio: 2.00

