The difference between success and failure in Forex trading is very likely to depend upon which currency pairs you choose to trade each week, and not on the exact trading methods you might use to determine trade entries and exits. Of course, the current market environment is one of crisis and very high volatility, and price movements are almost entirely dominated by the economic impact of the coronavirus pandemic. That is the dominant factor to consider in trading any market today.
Big Picture 26th April 2020
In my previous piece last week, I forecasted that the best trade was likely to be long of Gold in USD terms if it closed up at the end of Monday’s New York session. It did close up on Monday, and ended the week up by 1.96%, so this was a good trade.
Last week’s Forex market saw the strongest rise in the relative value of the Australian Dollar, and the strongest fall in the relative value of the New Zealand Dollar.
Fundamental Analysis & Market Sentiment
The world is not coming to an end, but we are living in an extraordinary time of global health crisis, the type of which has not been seen in one hundred years. There is a great deal of fear and panic, but it is important to remember that the evidence shows that the vast majority of people are going to survive and be healthy.
In time such as these, it is extremely difficult to make very short-term market forecasts, as the crisis can change focus day by day, strongly affecting sentiment and market movements. However, medium-term forecasts are easier to make as high levels of volatility tend to accompany see-sawing price movement.
We have seen the epicenter of the global pandemic move into the United States, especially New York, with fatalities hitting a high rate also in the U.K. However, the rolling average of deaths and new confirmed cases seems to be plateauing or even falling in both those countries, with Latin America seeing the most dramatic rises in new deaths and confirmed infections, especially Brazil. Daily deaths globally are beginning to fall.
The U.S. stock market has continued to rise following the announcement of a $2.2 trillion emergency stimulus package a few weeks ago and ongoing buying of U.S. stocks and other market instruments on a large scale by the Federal Reserve. However, important questions remain as to the sustainability of this rally even in the face of a huge drop in GDP and employment, which the U.S. economy is certain to suffer over the near term. U.S. unemployment nationwide is currently at approximately 15%. Many analysts see this ongoing stock market rise as bound to collapse.
It is clear that this crisis will enforce severe economic restrictions in all affected countries which will need to last for several weeks or even months. The only given is that stock markets and GDP generally will take severe hits, with Goldman Sachs now forecasting a 34% drop in U.S. GDP in the second quarter of 2020. The stock market crash we are seeing is comparable to 2008 and even 1929 so far. In fact, the speed of the initial drop of 20% from the all-time high price took only 15 market days to happen, compared to 30 days in 1929.
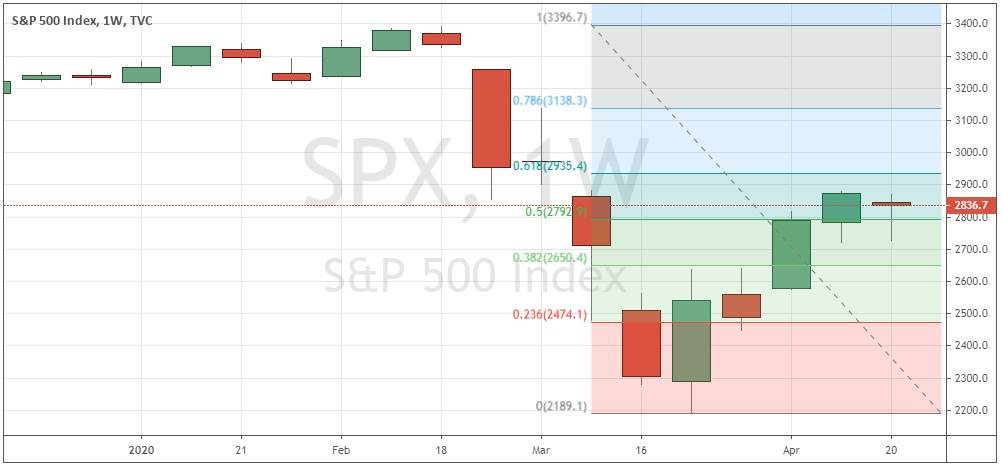
The S&P 500 Index has recovered more than 50% of the value of its peak to low move made in February and March. While this may be a sign that we have already seen the low, it should be remembered that the crash of 1929 was followed by an immediate recovery of more than 50% as well.
It seems clear that we will see a continued though maybe reduced level of high market volatility, at least in the stock market.
We are also starting to see a few countries that have had relatively successful lockdown measures begin to relax restrictions on the belief they have successfully dealt with a first wave of infections. These are smaller nations such as Denmark, Norway, Austria, Israel and the Czech Republic.
The U.S. is in a strange situation, with the virus running pretty rampant, yet we see increasing demands mostly from the political right to “reopen the economy”, despite the fact that 0.2% of the entire population of New York City has died from the virus in recent weeks, suggesting that the infection fatality rate truly is not far from 1% - although this is hotly disputed by many. One state in focus is Georgia, where the curve is still rising yet the state government has allowed many businesses, including hairdressers, to reopen.
Technical Analysis
U.S. Dollar Index
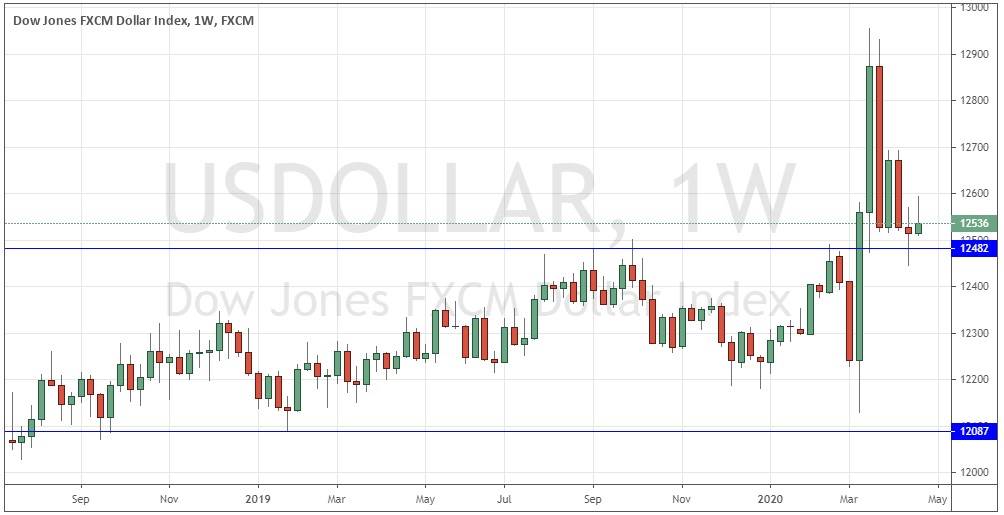
The weekly price chart below shows last week printed what is technically a small bearish pin candlestick, but which is still holding up above the support level shown at the blue horizontal line at 12482. There is a bullish trend reflected in the fact that the price is higher over both 3 and 6 months and the holding of support is also a bullish sign, but we are seeing a decline in volatility accompanied by a consolidation after very high volatility, so direction is extremely difficult to predict. Overall, next week’s price movement in the U.S. Dollar looks somewhat unpredictable but more likely to be up than down.
S&P 500 Index
The major U.S. stock market index – the biggest market index in the world closed down slightly this week for the first week since it made its major low five weeks ago. It is hard not to see further downwards movement as likely over the near to medium term due to the worsening, Great Depression-like situation regarding demand and output in both the U.S.A. and globally. However, it has to be admitted that the price has regained more than 50% of its recent decline, and continues to hold up above that level, so it may be that the 61.8% retracement zone shown in the chart below at about 2925 will be an area at which we could see a major bearish reversal. If the price continues to advance and begins to get established above the 3000 area, that would be a bullish sign. This price area is highly likely to be pivotal.
WTI Crude Oil
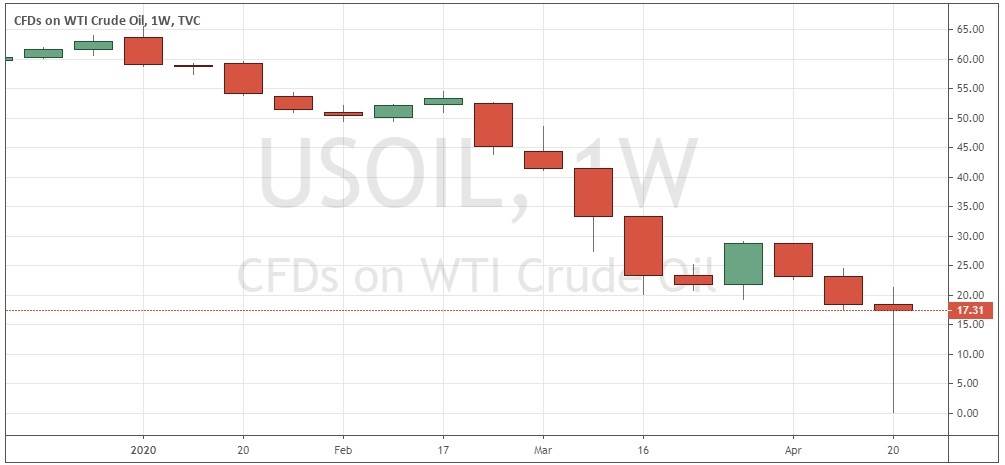
WTI Crude Oil made a bullish pin candlestick last week after making its lowest weekly close in decades the previous week. Oil futures went heavily into negative territory for the first time ever due to a supply glut and a lack of available storage space for the glut. If the global economy does somehow begin to recover, this could be a very long-term low in the price, but action is highly volatile and trading crude oil at present is an extremely risky business. Day traders may find WTI crude oil attractive at present due to the high volatility and just trade the swings on shorter time frames.
GOLD
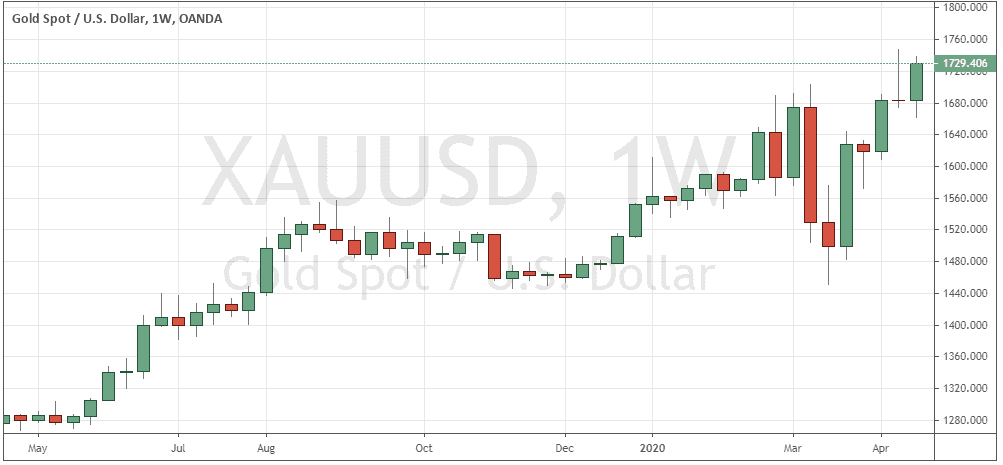
Gold made a strong upwards movement last week, reaching a new multi-year high weekly close at $1729, printing a firm and bullish candlestick. These are bullish indicators, both regarding the long-term bullish trend and the short-term price action. The coronavirus pandemic is arguably leading to the debasement of almost all currencies, so it makes sense that Gold will be a good long trade. However, I want to see a New York close on Monday at a new daily high at or above $1732 before making any long trade entry.
Conclusion
This week I forecast the best trade is likely to be long of Gold in USD terms if it closes at or above $1732 at the end of Monday’s New York session.


