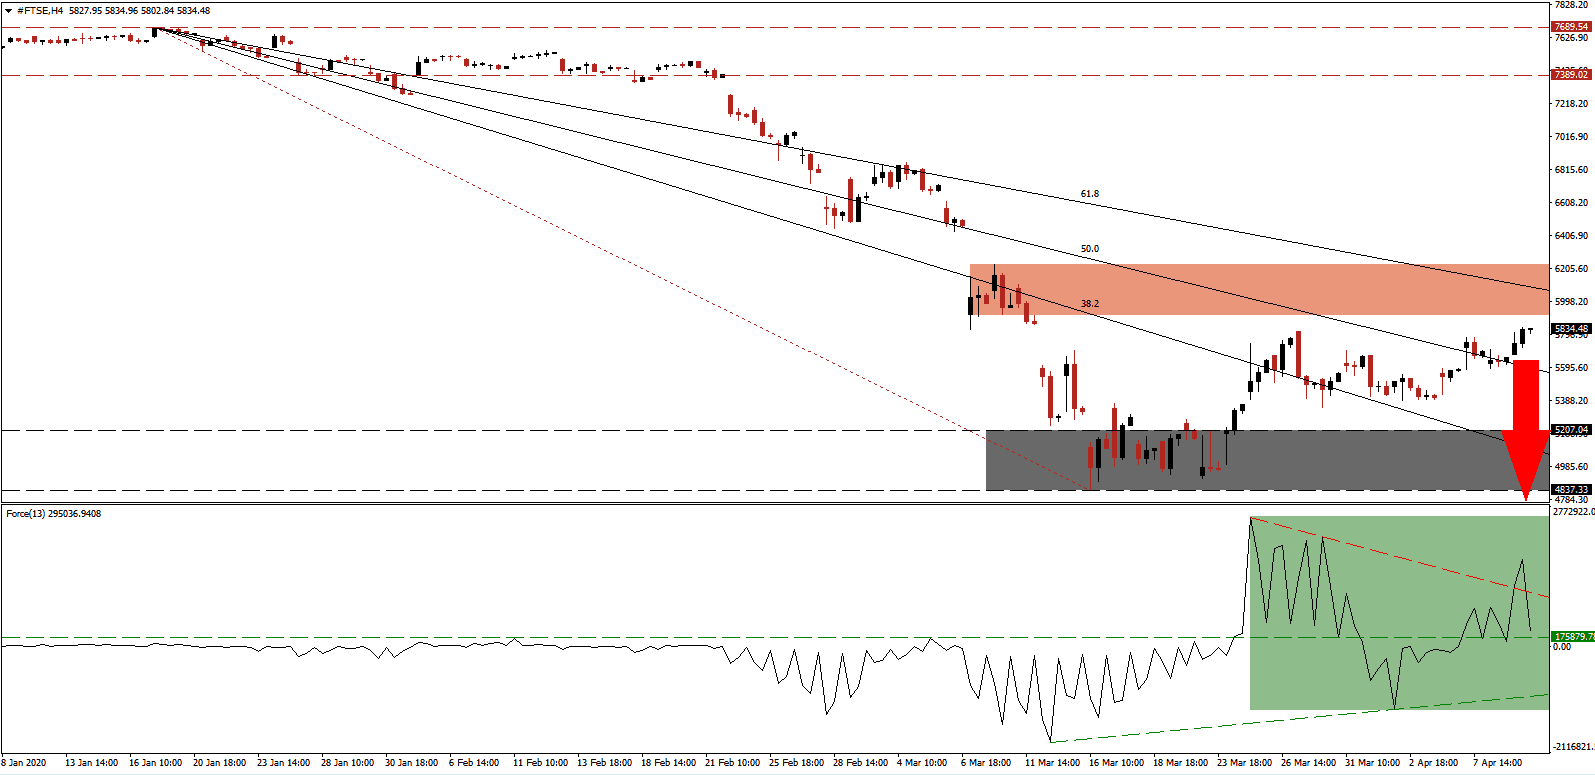
Following the initial sell-off across global financial markets, in response to the Covid-19 pandemic, bear markets commenced across developed markets. The steep contraction over a brief period resulted in a recovery, which possesses the characteristics of a bull-trap. It represents a counter-trend move within a more massive correction. While euphoria over the slowdown in confirmed Covid-19 cases and the related death toll in Italy sparked a recovery, the economic damages have yet to materialize. The FTSE 100 is likely to be guided lower by its descending Fibonacci Retracement Fan sequence.
The Force Index, a next-generation technical indicator, retreated from a lower high and below its descending resistance level, which served as temporary support, as marked by the green rectangle. A breakdown below its horizontal support level, converting it into resistance, is anticipated to follow. This technical indicator is vulnerable to a correction into its ascending support level, positioned in negative territory. It will cede control of the FTSE 100 to bears. You can learn more about the Force Index here.
Adding to downside pressures is the descending 61.8 Fibonacci Retracement Fan Resistance Level, which enforces the bearish chart pattern. It is currently crossing through the short-term resistance zone located between 5,915.66 and 6,228.06, as identified by the red rectangle. The UK announced a massive stimulus package, accounting for approximately 15% of GDP, but the majority of constituents in the FTSE 100 derive their revenues outside the UK. It exposes them to a collapse in earnings amid a pending global recession, together with sovereign government responses to the pandemic, which are inadequate in several cases.
Given the bearish outlook on earnings moving forward, the risk for the FTSE 100 remains to the downside. A breakdown below its 50.0 Fibonacci Retracement Fan Support Level, turning it into support, will provide a catalyst for price action to retest its support zone. This zone is located between 4,837.33 and 5,207.04, as marked by the grey rectangle. Economic data covering the start of the pandemic has been significantly worse than expected. A breakdown extension into its next support zone between 4,060.60 and 4,313.00, dating back to February 2009, cannot be ruled out. You can learn more about a breakdown here.
FTSE 100 Technical Trading Set-Up - Breakdown Resumption Scenario
Short Entry @ 5,830.00
Take Profit @ 4,830.00
Stop Loss @ 6,000.00
Downside Potential: 10,000 pips
Upside Risk: 1,700 pips
Risk/Reward Ratio: 5.88
A recovery in the Force Index above its descending resistance level is favored to pressure the FTSE 100 to the top range of its short-term resistance zone. A sustained advance is not expected, given the dominant bearish fundamental outlook into 2021. While the previous price gap to the downside may be closed before the resumption of the correction, it should be considered a selling opportunity.
FTSE 100 Technical Trading Set-Up - Limited Breakout Scenario
Long Entry @ 6,100.00
Take Profit @ 6,450.00
Stop Loss @ 5,930.00
Upside Potential: 3,500 pips
Downside Risk: 1,700 pips
Risk/Reward Ratio: 2.06

