Global Covid-19 cases surpassed two million, and the US the epicenter of the virus, accounting for roughly one-third of all infections. Economies are unable to afford the hibernation phase and draconian measures implemented on billions of people, funded by a massive rise in debt. More than 70 vaccines are currently in trial-phases, but this process requires between 12-to-18 months. Many unknowns exist about the virus, and a slow realization starts to set in that society needs to learn how to live with and adapt to it, unless more data becomes available. Unlike SARS, which was quickly eliminated, Covid-19 may join influenza as an annually mutating and recurring infection. Gold, the primary safe-haven asset, is favored to extend its breakout to new 2020 highs, well-positioned to push through its all-time peak of 1,919.80 and significantly above 2,000.
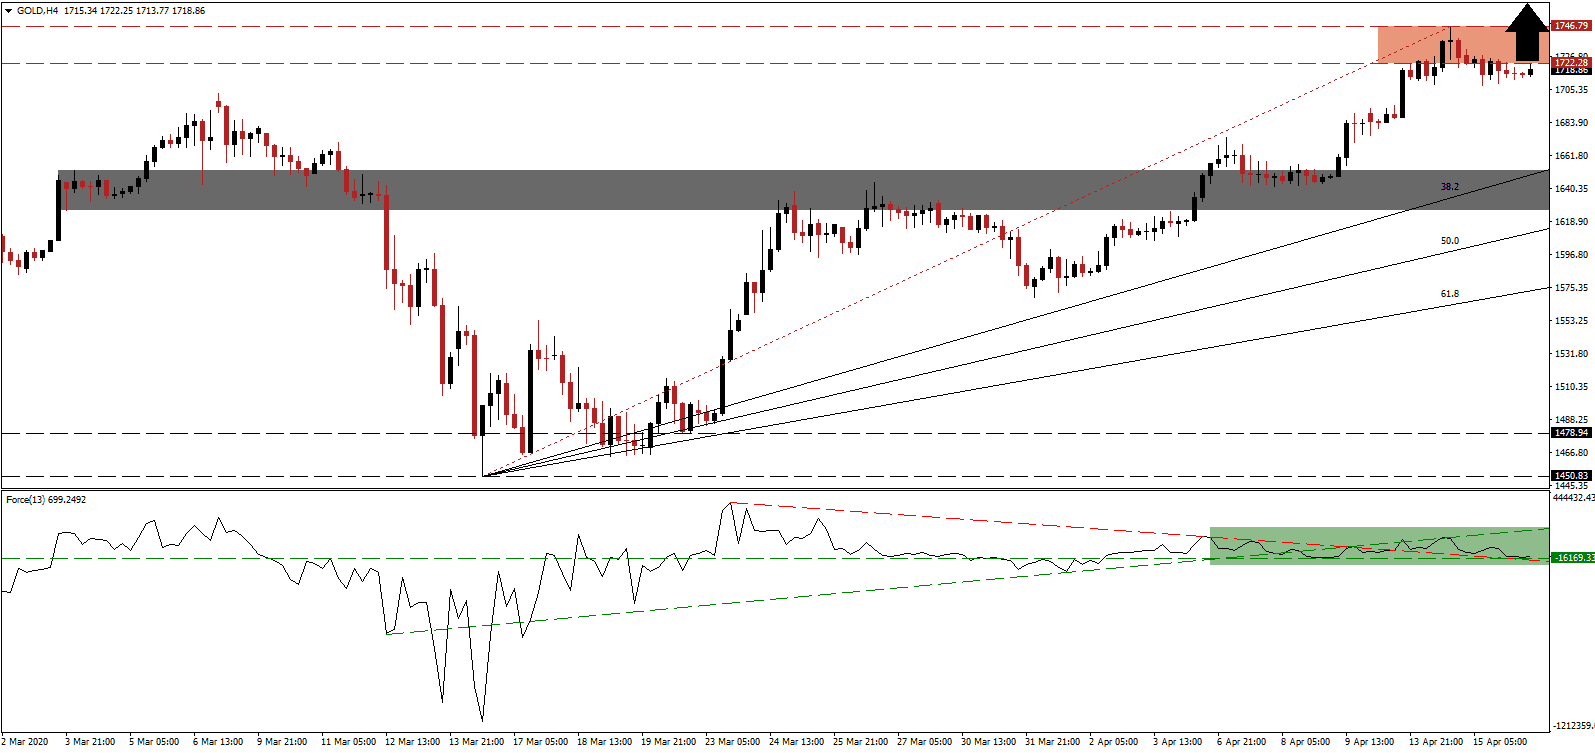
The Force Index, a next-generation technical indicator, remains above its horizontal support level but bullish momentum eased, confirming a temporary pause in price action. The ascending support level and descending resistance level switched roles, as marked by the green rectangle. Bulls are in full control of gold, with this technical indicator maintaining its position in positive territory. A renewed push to the upside is expected to lead this precious metal into its next breakout. You can learn more about the Force Index here.
A series of higher highs and higher lows confirmed the existence of a bullish chart formation, likely to remain in place for an extended period, as markets adjust to a new economic reality. The ascending Fibonacci Retracement Fan sequence enforces the uptrend in gold, and the 38.2 Fibonacci Retracement Fan Support Level is in the process to exit its short-term support zone. This zone is located between 1,626.10 and 1,652.21, as identified by the grey rectangle. A move above this zone will provide an additional bullish catalyst.
While governments continue to compare Covid-19 to the SARS or MERS outbreaks, believing a quick economic recovery will follow a steep recession, the upside potential for gold increases. Failure to recognize the severity and differences between the viruses, in conjunction with the forced economic modification required, multiplies the long-term negative impact of Covid-19 on a global level. A breakout in this precious metal above its resistance zone located between 1,722.28 and 1,749.79, as marked by the red rectangle, is anticipated. The next resistance zone awaits between 1,801.60 and 1,826.50, from where a test of its all-time high of 1,919.80 should be expected.
Gold Technical Trading Set-Up - Breakout Extension Scenario
Long Entry @ 1,718.00
Take Profit @ 1,918.00
Stop Loss @ 1,668.00
Upside Potential: 20,000 pips
Downside Risk: 5,000 pips
Risk/Reward Ratio: 4.00
A sustained breakdown in the Force Index below its descending resistance level could force a minor correction in gold. Due to the worsening long-term global economic outlook, together with the failure to realize the challenges ahead by a vast number of governments, the downside potential is confined to the bottom range of its short-term support zone. The 50.0 Fibonacci Retracement Fan Support Level provides a second support layer, and traders are advised to take advantage of any corrective moves with new net buy orders.
Gold Technical Trading Set-Up - Limited Correction Scenario
Short Entry @ 1,653.00
Take Profit @ 1,623.00
Stop Loss @ 1,668.00
Downside Potential: 3,000 pips
Upside Risk: 1,500 pips
Risk/Reward Ratio: 2.00

