Germany eased several lockdown measures, which resulted in a rise in Covid-19 infections and no meaningful economic activity. The combination is the worst possible outcome, and other countries debate following the same approach. It increases the risk of a second infection wave this summer, dealing a potentially devastating blow to the global economy already in a recession. A premature downgrade of the situational status, driven by a need to restart economies, elevates the risks for a sustained recovery. Fundamental conditions provide a bullish catalyst for gold, likely to inspire a new breakout sequence.
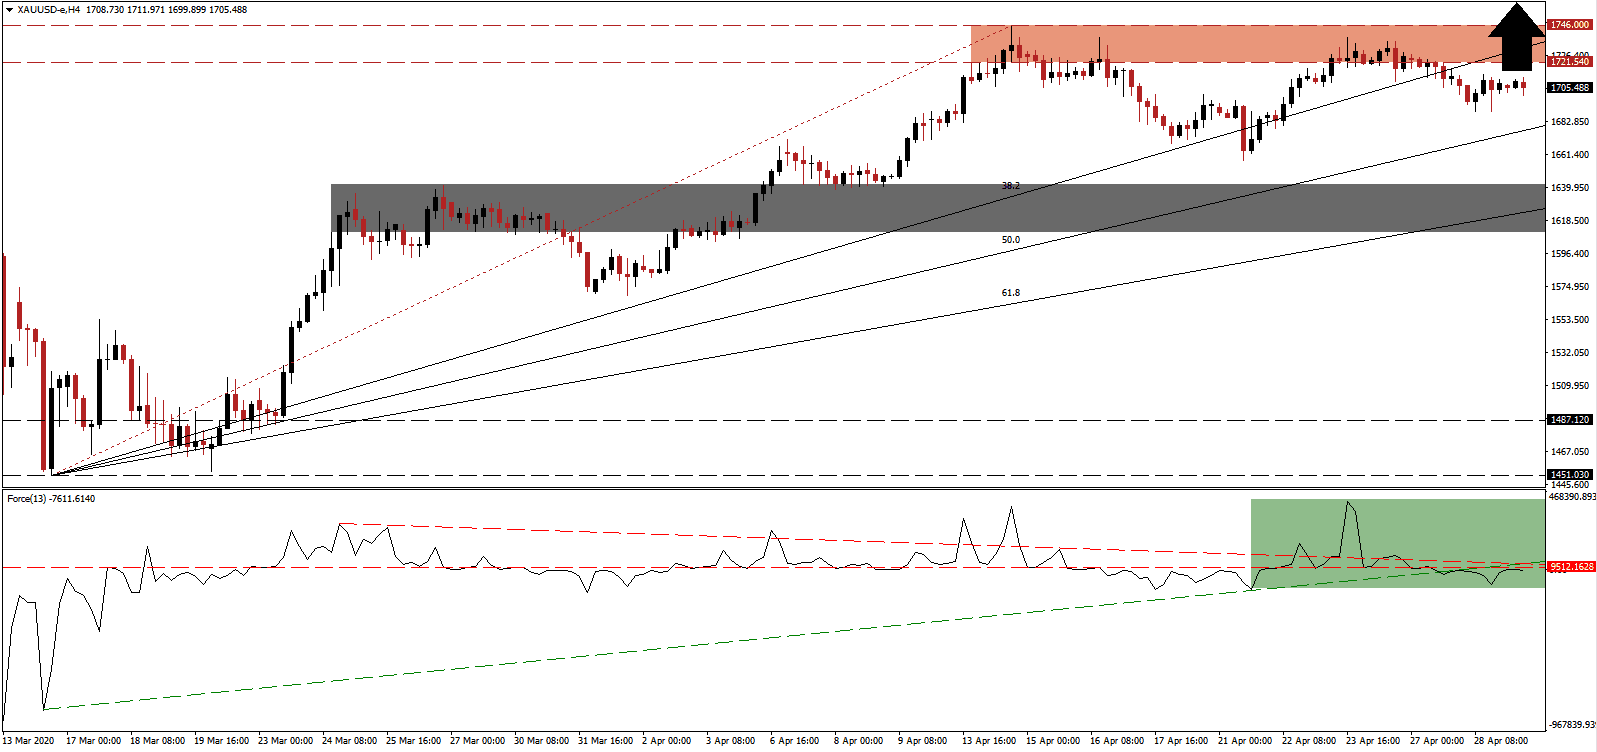
The Force Index, a next-generation technical indicator, is challenging its horizontal resistance level, which is enforced by its descending resistance level, as marked by the green rectangle. Bearish pressures initially rose following the breakdown in the Force Index below its ascending support level but eased as Covid-19 related developments indicate a global economy significantly weaker than previously hoped. Mistakes by governments and policymakers in handling and responding to the coronavirus are adding to long-term bearish catalysts. This technical indicator is favored to accelerate into positive territory, allowing bears to resume control of price action in gold.
As the Covid-19 pandemic forced nationwide lockdowns, enforcing draconian measures on billions of global citizens, the primary government response was a sharp increase in debt to already unsustainable levels. While they were intended as a short-term measure to support payrolls and businesses, calls have grown for a permanent basic universal income with a potentially devastating effect on the global economy. Financial markets misprice permanent damages caused by irregular responses to a disruptive event. It supports more significant gains in the price of gold, while the short-term support zone located between 1,610.12 and 1,641.51, as marked by the grey rectangle, is adjusted upwards, limiting the downside potential of counter-trend sell-offs.
This precious metal is now located below the bottom range of its resistance zone located between 1,721.54 and 1,746.00, as identified by the red rectangle, and above its ascending 50.0 Fibonacci Retracement Fan Support Level. With more economic data disappointments released weekly, a gradual return of a risk-off sentiment is expected. Gold is well-positioned to advance to a new 2020 high. Price action will face its next resistance zone between 1,802.78 and 1,827.35, dating back to September 2011. More gains cannot be excluded, on the back of rising bullish conditions for safe-haven assets.
Gold Technical Trading Set-Up - Breakout Scenario
Long Entry @ 1,705.00
Take Profit @ 1,827.00
Stop Loss @ 1,669.00
Upside Potential: 12,200 pips
Downside Risk: 3,600 pips
Risk/Reward Ratio: 3.39
In the event the descending resistance level pushes the Force Index farther into negative territory, gold can extend its current breakdown. Temporary corrections are required to ensure the longevity of the long-term bullish trend. The downside potential is limited to its short-term support zone. Traders are advised to view any sell-off as an excellent buying opportunity in this precious metal.
Gold Technical Trading Set-Up - Limited Breakdown Extension Scenario
Short Entry @ 1,657.00
Take Profit @ 1,627.00
Stop Loss @ 1,669.00
Downside Potential: 3,000 pips
Upside Risk: 1,200 pips
Risk/Reward Ratio: 2.50

