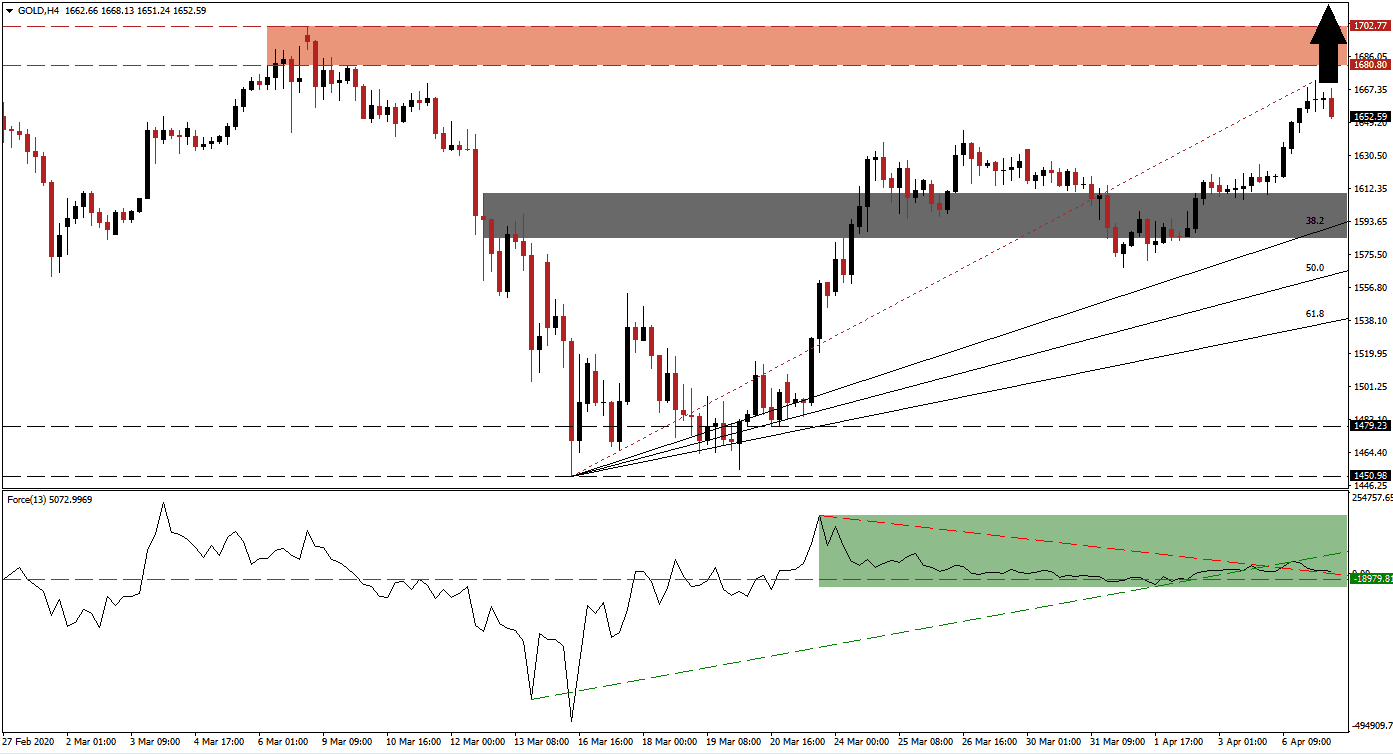
With Austria and Denmark relaxing lockdown measures, Germany drafting plans to return to a new normal, and the global death toll easing, many expect the Covid-19 peak has been reached or will be reached over the next two weeks. It resulted in global equity markets rallying, volatility dropping, and optimism to take hold. The positive headlines narrating the global pandemic, should not be mixed with the source of economic stability. A global recession remains a significant threat, mispriced in current markets, but evident in the gold. Price action established a dominant bullish chart pattern, reinforced by the breakout above its short-term support zone.
The Force Index, a next-generation technical indicator, shows the pick-up in bullish momentum after a period of contraction. It recovered after reaching its ascending support level and extended above its descending resistance level. The Force Index remains above its horizontal support level, as marked by the green rectangle. Bulls are in control of gold with this technical indicator in positive territory, favored to push this precious metal farther to the upside. You can learn more about the Force Index here.
Following the breakout in gold above its short-term support zone located between 1,584.07 and 1,609.40, as identified by the grey rectangle, gold recorded a higher high. It resulted in an adjustment to the Fibonacci Retracement Fan sequence to reflect bullish momentum expansion. This precious metal may challenge the top range of this zone, enforced by the ascending 38.2 Fibonacci Retracement Fan Support Level, before accelerating to the upside. While the global death toll is slowing, the start of long-lasting economic problems has yet to begin.
Adjustments to the global supply chain, recalibration of domestic economies to reduce reliance on imports, and a massive spike in global debt will create significant issues for countries to face moving forward. Debt defaults, inflation, and persistent unemployment are currently dismissed by markets. It creates ideal conditions for gold to spike into its resistance zone located between 1,680.80 and 1,702.77, as marked by the red rectangle. A breakout appears likely, which can extend the advance into its next resistance zone awaiting between 1,772.52 and 1,795.25, dating back to September 2012.
Gold Technical Trading Set-Up - Breakout Extension Scenario
Long Entry @ 1,652.00
Take Profit @ 1,795.00
Stop Loss @ 1,606.00
Upside Potential: 14,300 pips
Downside Risk: 4,600 pips
Risk/Reward Ratio: 3.11
In case of a contraction in the Force Index below its descending resistance level, serving as short-term support, gold is anticipated to face more selling pressure. Due to numerous risks to the global economy resulting from the response of governments to the Covid-19 pandemic, any breakdown should be viewed as an excellent buying opportunity. The downside potential remains limited to the 61.8 Fibonacci Retracement Fan Support Level.
Gold Technical Trading Set-Up - Limited Breakdown Scenario
Short Entry @ 1,575.00
Take Profit @ 1,540.00
Stop Loss @ 1,590.00
Downside Potential: 3,500 pips
Upside Risk: 1,500 pips
Risk/Reward Ratio: 2.33

