Japan unveiled a record-breaking ¥108 trillion economic stimuli, equivalent of 20% of GDP. It surpassed the UK’s 15% of GDP package and serves as a reminder of severe problems related to the global Covid-19 pandemic yet to materialize. Japan waited longer than any other major economy to announce a stimulus, suggesting careful long-term planning may have played a part in the unprecedented move. The economy struggled since the bailout of its financial system in the late ’90s, but the Japanese Yen is considered the primary safe-haven asset in the Forex market. The USD/JPY is anticipated to enter a new breakdown sequence.
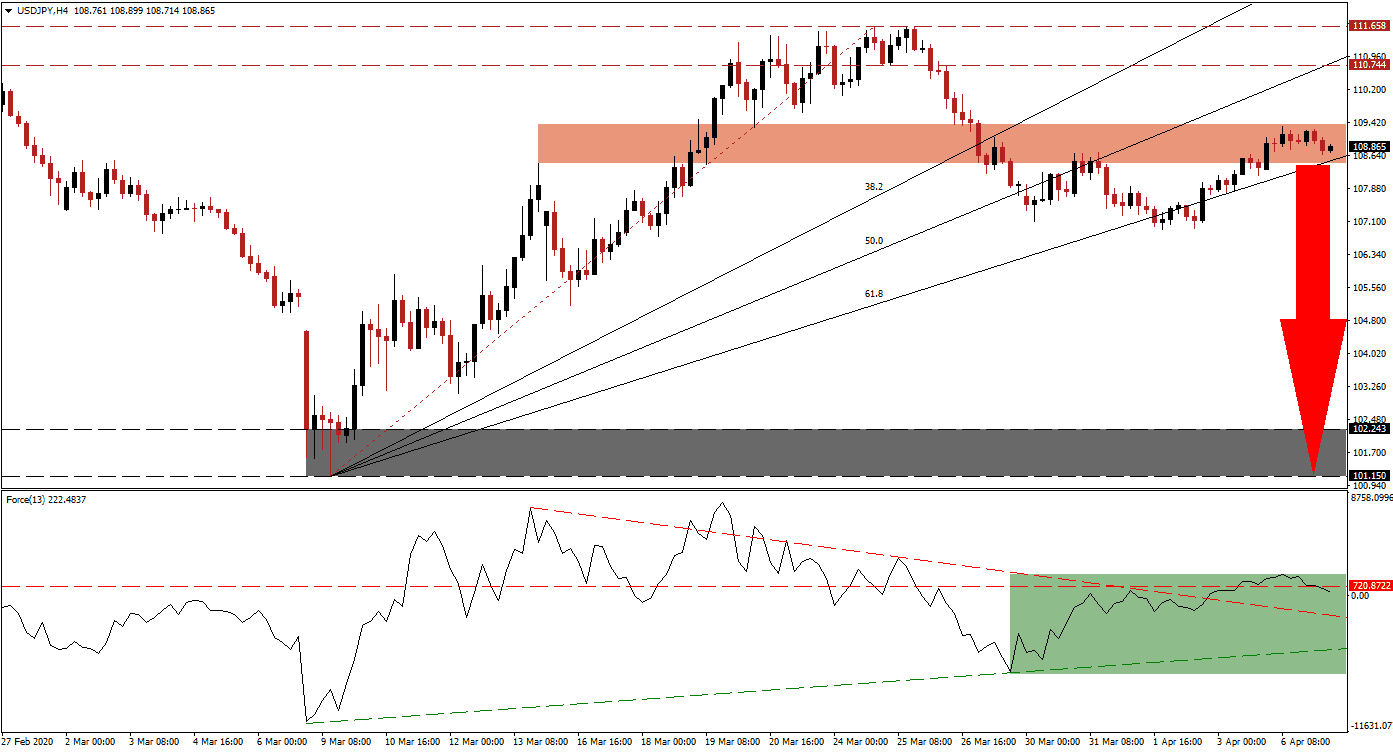
The Force Index, a next-generation technical indicator, suggests more downside after converting its horizontal support level into resistance. A contraction below its descending resistance level, acting as temporary support, is expected to pressure the USD/JPY into a breakdown. The Force Index is well-positioned to extend its correction below its ascending support level, as marked by the green rectangle. Bears will take control of this currency pair following a crossover below the 0 center-line.
This morning’s Japanese data showed a surprise increase in real cash earnings for February, together with a minor contraction in household spending. The preliminary leading and coincident indicators surprised to the upside. While this data is for February, it showed a more stable condition than previously anticipated. Economic data out of the US indicates a more severe scenario with over ten million job losses over the past two weeks. The USD/JPY is likely to collapse below its short-term resistance zone located between 108.454 and 109.371, as identified by the red rectangle.
With the ascending 61.8 Fibonacci Retracement Fan Support Level entering this zone, pressures on price action are on the rise. A breakdown is favored to spark a profit-taking sell-off in this currency pair. One essential level to monitor is the intra-day low of 106.948, the low of the previous breakdown in the USD/JPY below its short-term resistance zone. A sustained pushed below this level is likely to take price action into its support zone located between 101.150 and 102.243, as marked by the grey rectangle. You can learn more about a profit-taking sell-off here.
USD/JPY Technical Trading Set-Up - Breakdown Scenario
Short Entry @ 108.850
Take Profit @ 101.850
Stop Loss @ 110.850
Downside Potential: 700 pips
Upside Risk: 200 pips
Risk/Reward Ratio: 3.50
Should the Force Index bounce off of its descending resistance level, the USD/JPY could attempt an acceleration through its long-term resistance zone located between 110.744 and 111.658. Forex traders are recommended to sell any price spikes from current levels due to the mispriced risk related to economic damages from Covid-19. This currency pair will face its next resistance zone between 112.155 and 112.396.
USD/JPY Technical Trading Set-Up - Limited Breakout Scenario
Long Entry @ 111.350
Take Profit @ 112.350
Stop Loss @ 110.850
Upside Potential: 100 pips
Downside Risk: 50 pips
Risk/Reward Ratio: 2.00


