With the global Covid-19 pandemic keeping the economy hostage, the Bank of Japan notes financial risks related to the crisis. Governments and central banks responded to the abrupt halt of nearly all activities by announcing massive stimulus programs, slashing interest rates from already historically low levels, and restarting or enhancing quantitative easing. Markets initially cheered the response, but the focus is slowly shifting towards the long-term costs and potential of a debt crisis following the peak of the pandemic. Artificially stimulating the global economy will lead to slower long-term growth, a realization not priced into financial markets. The negative shock of this development favors safe-haven assets, positioning the USD/JPY for a breakdown, and profit-taking sell-off from present levels.
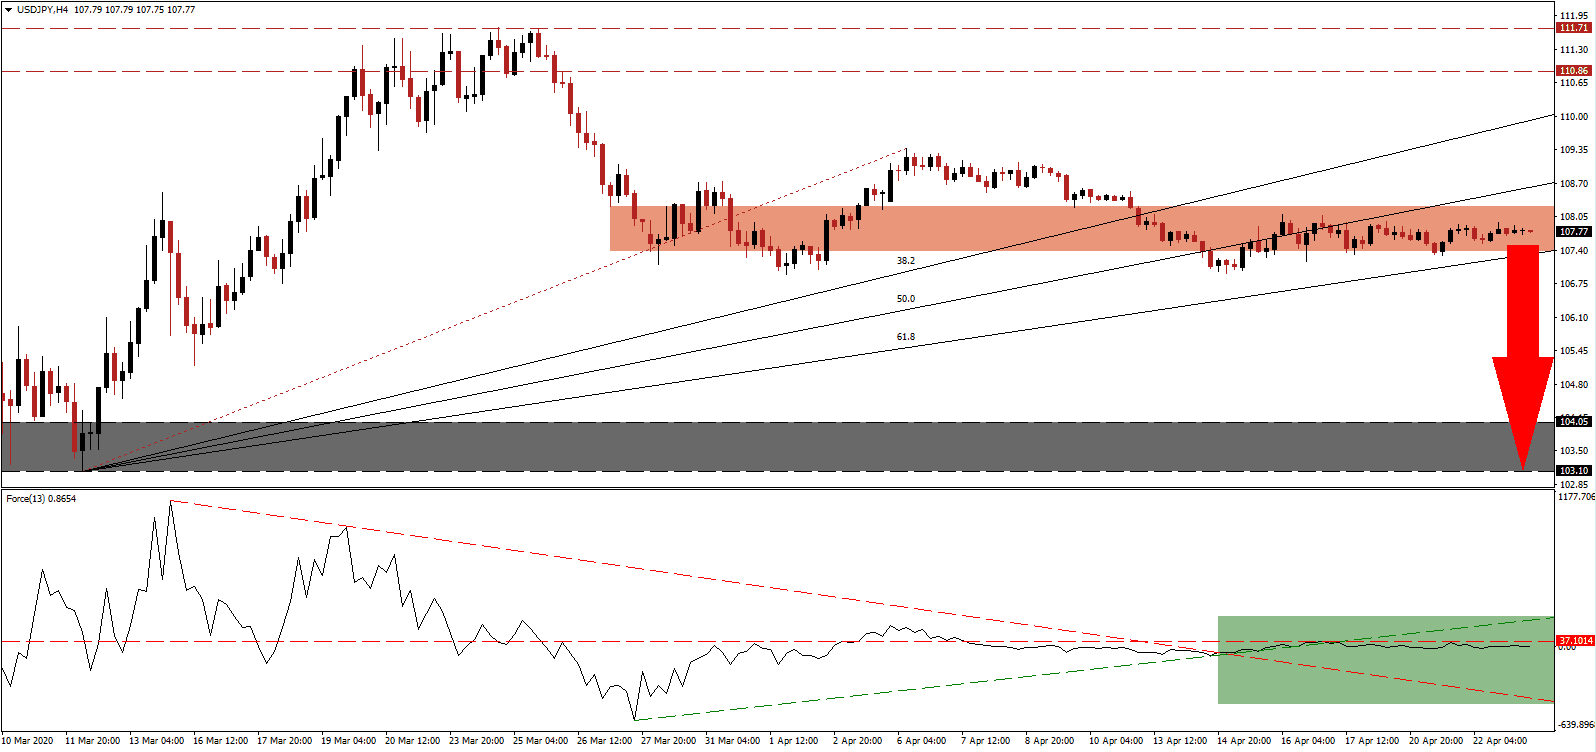
The Force Index, a next-generation technical indicator, confirms the dominance of bearish pressures. It remains below its horizontal resistance level, while the ascending support level and the descending resistance level switched roles temporarily, as marked by the green rectangle. This technical indicator is expected to drift below the 0 center-line, ceding control of the USD/JPY to bears, from where an accelerated sell-off is likely to materialize. You can learn more about the Force Index here.
This currency pair entered a sideways trend inside of its short-term resistance zone located between 108.25 and 107.37, as identified by the red rectangle. The ascending 61.8 Fibonacci Retracement Fan Support Level is on the verge of entering the bottom range, with the remainder of the Fibonacci Retracement Fan sequence above it. Breakdown pressures are accumulating, and the USD/JPY is anticipated to receive a fundamental catalyst with today’s US economic data, which included initial jobless claims and April PMI data.
A double breakdown is favored to force an accelerated sell-off in the USD/JPY. One essential level to monitor is the intra-day low of 106.94, the base from where the most recent contraction below the short-term support zone was reversed. A sustained collapse will clear the path for price action to retest its long-term support zone located between 103.10 and 104.05, as marked by the grey rectangle. New net sell-orders are expected to fuel the breakdown extension in this currency pair.
USD/JPY Technical Trading Set-Up - Breakdown Scenario
Short Entry @ 107.75
Take Profit @ 103.10
Stop Loss @ 108.75
Downside Potential: 465 pips
Upside Risk: 100 pips
Risk/Reward Ratio: 4.65
Should the Force Index spike above its ascending support level, serving as short-term resistance, the USD/JPY is likely to attempt a breakout. Given absolute fundamental conditions, the upside is restricted to the long-term resistance zone located between 110.86 and 111.71. With the release of more economic data, and the risk of a second wave of infections resulting from a rush to lift present restrictions on society, the outlook for this currency pair remains increasingly bearish.
USD/JPY Technical Trading Set-Up - Limited Breakout Scenario
Long Entry @ 109.50
Take Profit @ 111.00
Stop Loss @ 108.75
Upside Potential: 150 pips
Downside Risk: 75 pips
Risk/Reward Ratio: 2.00

