USD/CNH
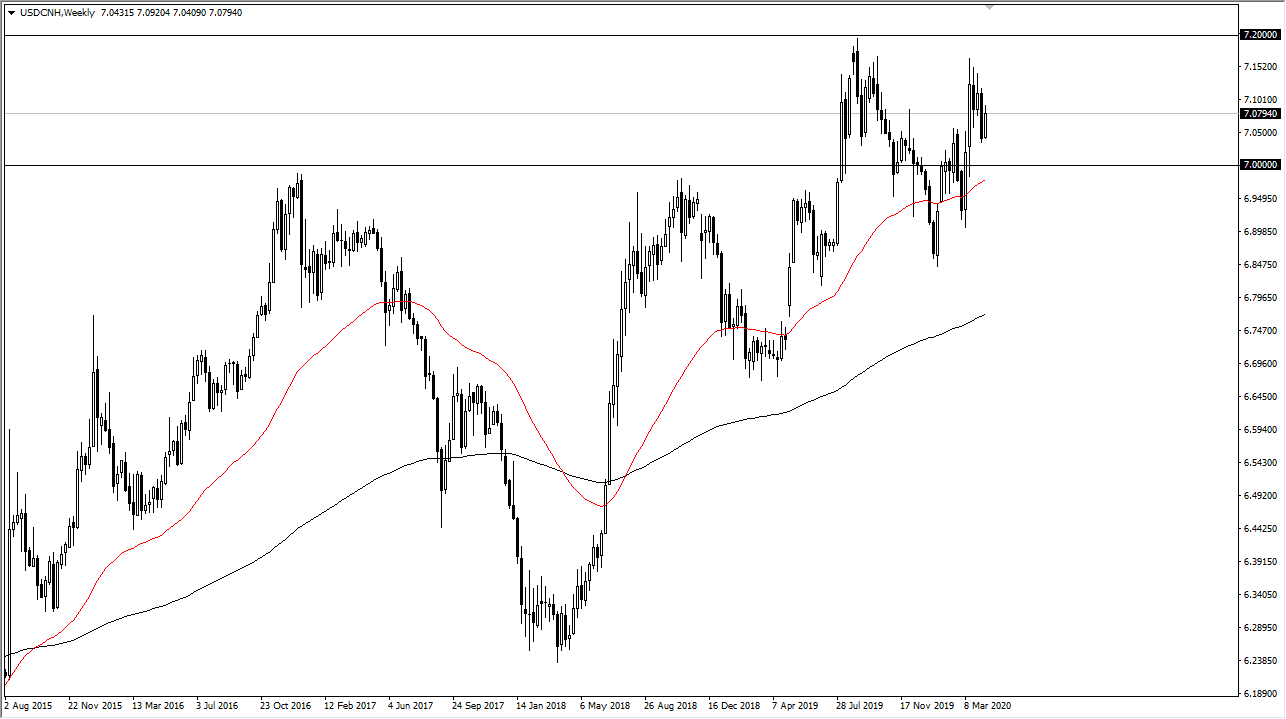
I know a lot of you don’t necessarily trade the Chinese offshore currency, but the reality is that it’s very important to pay attention to what’s going on in this chart. Currently, it looks as if the US dollar continues to climb higher over the longer term, and this of course has major ramifications when it comes to emerging market currencies, as well as risk appetite. While the stock market celebrated in a major “risk on” move during the back half of the week, the reality is the US dollar has flexed its muscles a bit. This tells me that the currency market doesn’t believe the “all clear” narrative.
EUR/USD
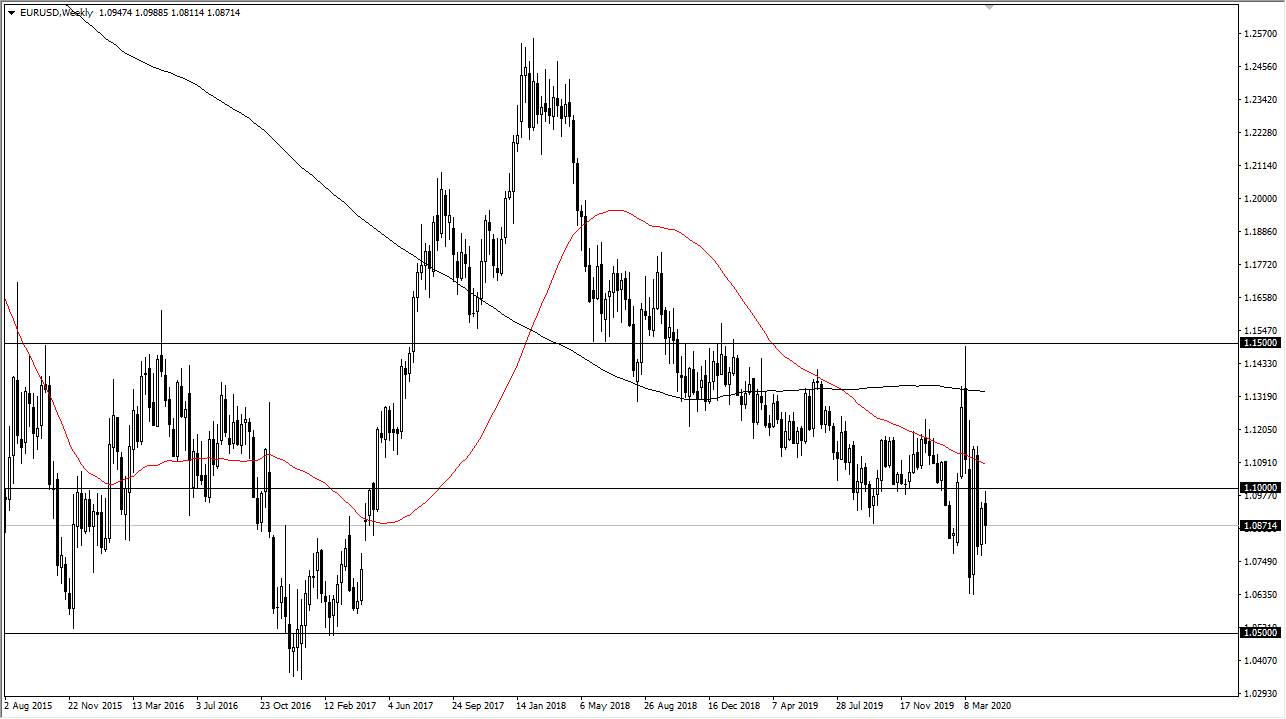
The Euro was all over the place during the week, initially trying to get above the 1.10 level before breaking back down to the bottom of the range for the previous week and then bouncing slightly. Ultimately, we did end up forming a negative candlestick, and it looks to me like the Euro is going to go sideways in general, with the 1.10 level offering a significant amount of resistance. I think the 1.08 level also offers a significant amount of support. Expect a lot of choppiness but overall, I still favor the downside.
GBP/USD
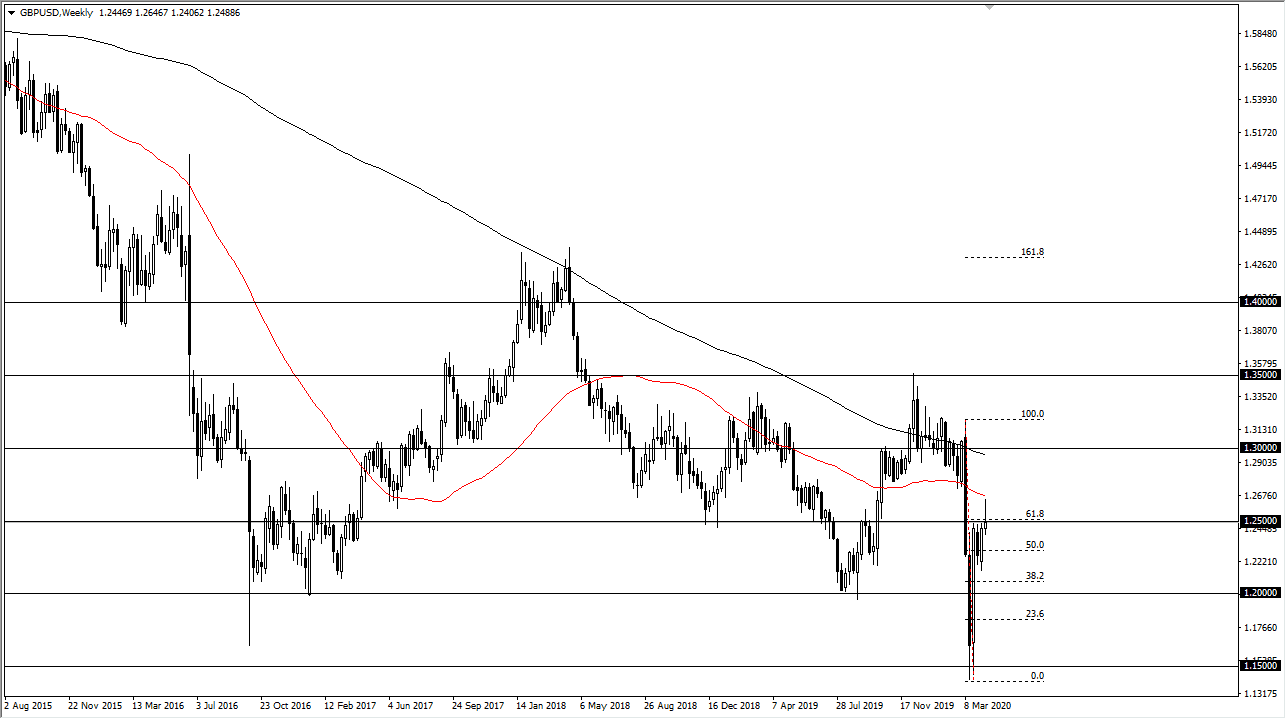
The British pound initially shot higher during the week, but by the time we closed out on Friday we did up forming a bit of a shooting star. This shows that the 1.25 level is of course offering quite a bit of resistance, and I do think that it’s only a matter of time before we break down. However, you if we break the high of the week then it’s very likely we go looking towards 1.2750 level above. Ultimately, if we break down below the weekly candlestick from last week, then the market is likely to go looking towards 1.2250 level, and then possibly the 1.20 level after that.
USD/JPY
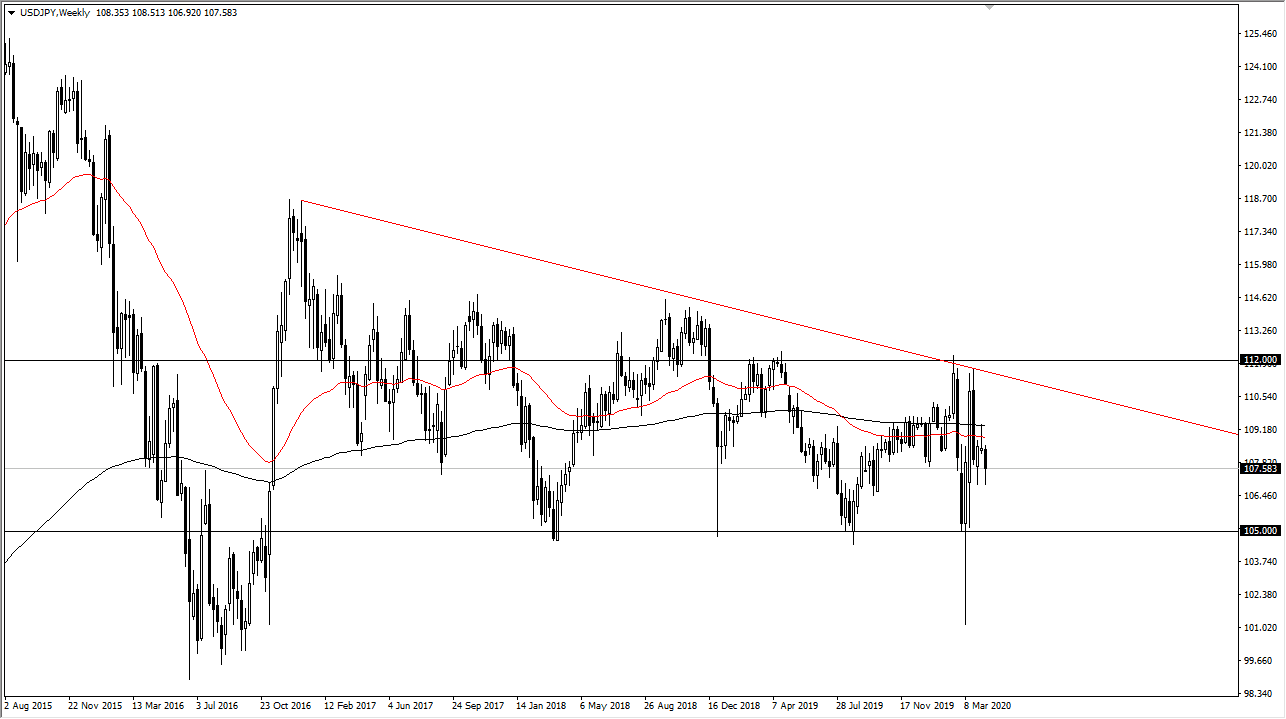
The US dollar has been chopping back and forth between the ¥107 level on the bottom and the ¥109 level on the top. I think we continue to bang around overall in this currency pair, perhaps with a little bit more in the way of downward attitude. If we break down below the ¥107 level, I think we get to the 105 level rather quickly. I am much more bearish than bullish, but overall, more neutral than either one of those. I feel better selling short-term rallies but will more than likely use the chart as an indicator of Japanese yen strength or weakness.


