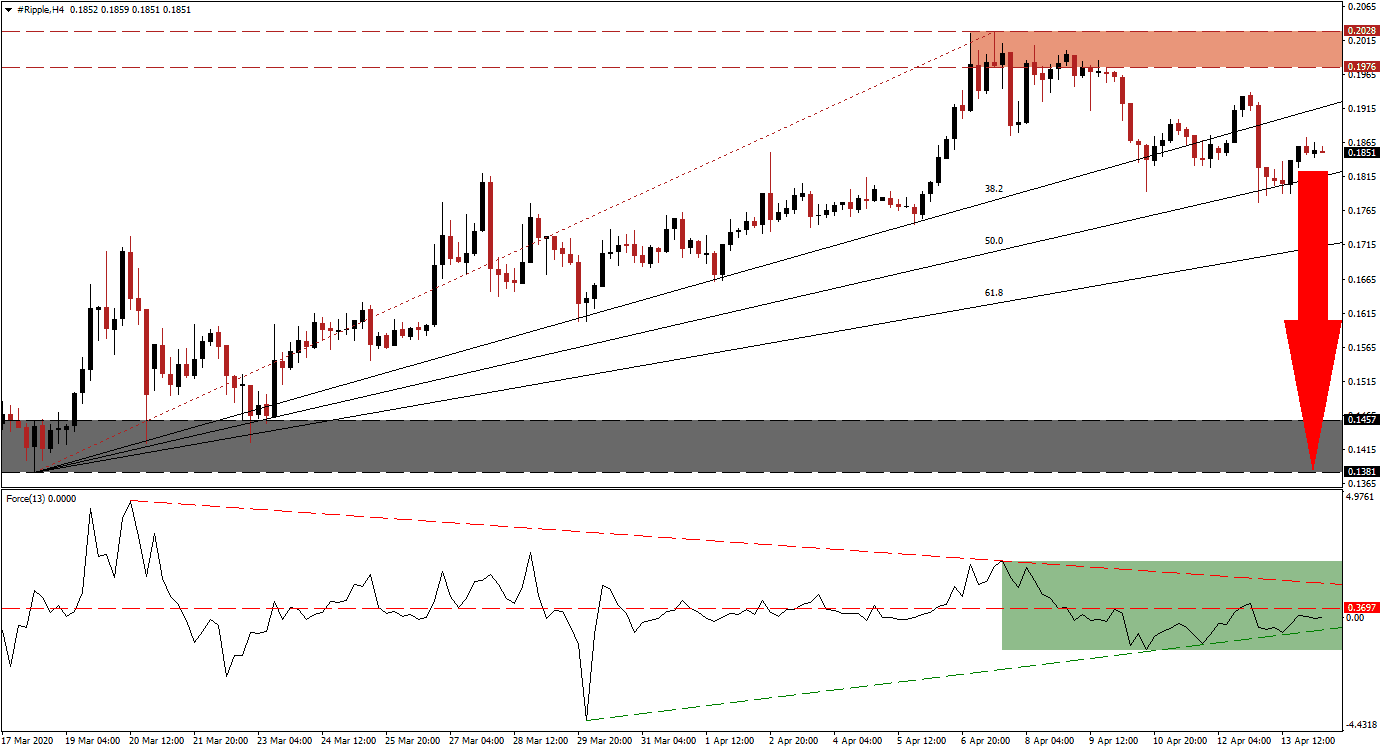
Ripple has staged a massive recovery in percentage terms after the initial response to the global Covid-19 pandemic forced broad-based selling across the financial market. Pure cryptocurrency enthusiasts believed that after the 2008 global financial crisis, their emerging market was disconnected from the rest of the interconnected world, and immune to crises. After the XRP/USD carved out a reaction low to the institutional-led sell-off, it rallied 88.60% into its resistance zone, before being rejected. A series of lower highs and lower lows emerged, positioning price action for the second wave of sell orders.
The Force Index, a next-generation technical indicator, retreated from a lower high. It converted its horizontal support level into resistance, as marked by the green rectangle. With the ascending support level narrowing the gap to the horizontal resistance level, breakdown pressures remain elevated. The descending resistance level is adding to bearish momentum, favoring a collapse in the Force Index. Bears await a breakdown in this technical indicator into negative territory to retake control of price action in the XRP/USD.
Following the rejection of the recovery in the XRP/USD by its resistance zone located between 0.1976 and 0.2028, as marked by the red rectangle, a bearish chart pattern formed. Adding to bearish developments was the breakdown in price action below its ascending 38.2 Fibonacci Retracement Fan Support Level, converting it into resistance. While this cryptocurrency pair bounced off of its 50.0 Fibonacci Retracement Fan Support Level, a renewed contraction is anticipated on the back of ongoing capital needs with global equity markets at risk to retest their March lows.
Traders are recommended to monitor the intra-day low of 0.1777, the current base of the breakdown sequence in the XRP/USD. A push lower is expected to initiate the second wave of sell net sell orders, providing the required volume to pressure price action below its 61.8 Fibonacci Retracement Fan Support Level. It will clear the path for an extended corrective phase into its support zone located between 0.1381 and 0.1457, as identified by the grey rectangle. You can learn more about a breakdown here.
XRP/USD Technical Trading Set-Up - Breakdown Extension Scenario
- Short Entry @ 0.1850
- Take Profit @ 0.1400
- Stop Loss @ 0.1945
- Downside Potential: 450 pips
- Upside Risk: 95 pips
- Risk/Reward Ratio: 4.74
In case the Force Index sustains a breakout above its descending resistance level, the XRP/USD will receive a bullish catalyst. Price action is then likely to push through its resistance zone and extend its recovery. Volatility is favored to increase with the direction of equity markets dictating moves in the cryptocurrency sector. The next resistance zone is located between 0.2207 and 0.2318.
XRP/USD Technical Trading Set-Up - Breakout Scenario
- Long Entry @ 0.2045
- Take Profit @ 0.2300
- Stop Loss @ 0.1945
- Upside Potential: 255 pips
- Downside Risk: 100 pips
- Risk/Reward Ratio: 2.55

