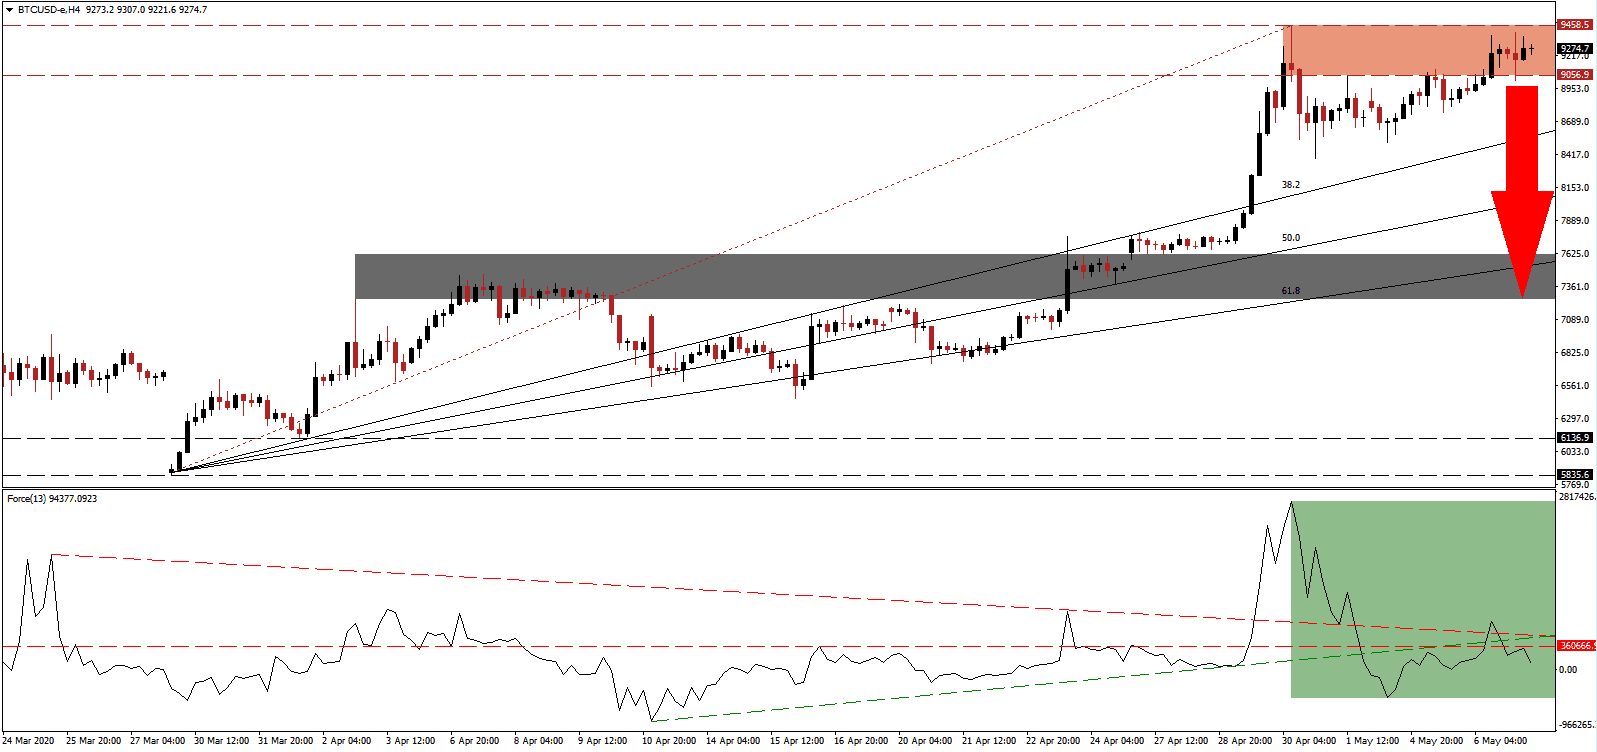
Bitcoin will undergo its third halving event next week, eagerly anticipated by investors and traders alike. Retail demand has driven this cryptocurrency pair higher following its March low below 3,700 based on hopes of a massive surge in price action. The previous two allowed the BTC/USD to accelerate to new all-time highs, but this one may disappoint and initiate an extensive sell-off. Miners, the backbone of the network, are faced with stagnant profitability and will see rewards drop by 50% next week. It may force an exodus of capacity, crashing the hashrate, and dragging the price into a breakdown sequence. Volatility is likely to increase over the next few weeks, but a bearish bias remains dominant.
The Force Index, a next-generation technical indicator, retreated from a brief spike above its descending resistance level and is now positioned below its horizontal resistance level. An increase in breakdown pressures emerged after the Force Index collapsed below its ascending support level, as marked by the green rectangle. This technical indicator is on track to push through its 0 center-line and allow bears to regain control of the BTC/USD. You can learn more about the Force Index here.
After retail demand pushed this cryptocurrency pair into its resistance zone located between 9,056.90 and 9,458.50, as identified by the red rectangle, institutional selling may force a profit-taking sell-off. Adding to bearish developments is a resurgence in Covid-19 infections as governments ease lockdown restrictions with the virus mutating, presenting existing vaccine research and trials useless. A repeat of the BTC/USD collapse from the first quarter is, therefore, a risk that should not be ignored, with equity markets at risk of a second wave of selling.
Following a breakdown, the gap between the BTC/USD and its ascending 38.2 Fibonacci Retracement Fan Support Level is expected. Downside volume should suffice to extend the correction into its next short-term support zone located between 7,253.00 and 7,617.60, as marked by the grey rectangle. The 61.8 Fibonacci Retracement Fan Support Level is crossing through this zone. Failure to halt the pending contraction will position price action for a more significant downside into its support zone located between 5,835.60 and 6,139.90.
BTC/USD Technical Trading Set-Up - Profit-Taking Scenario
Short Entry @ 9,275.00
Take Profit @ 7,375.00
Stop Loss @ 9,675.00
Downside Potential: 190,000 pips
Upside Risk: 40,000 pips
Risk/Reward Ratio: 4.75
In the event of a breakout in the Force Index above its ascending support level, the BTC/USD may follow suit. With the halving event favored to crush the hashrate and the economic threats of the mutating Covid-19 virus, the upside potential remains restricted to its next resistance zone. It is located between 10,293.40 and 10,505.30, which presents an outstanding second entry-opportunity for new net short positions.
BTC/USD Technical Trading Set-Up - Limited Breakout Scenario
Long Entry @ 9,900.00
Take Profit @ 10,400.00
Stop Loss @ 9,675.00
Upside Potential: 50,000 pips
Downside Risk: 22,500 pips
Risk/Reward Ratio: 2.22

