The difference between success and failure in Forex trading is very likely to depend upon which currency pairs you choose to trade each week, and not on the exact trading methods you might use to determine trade entries and exits. Of course, the current market environment is one of crisis and relatively high volatility, and price movements are mostly dominated by the perceived economic impact of the coronavirus pandemic. That is the dominant factor to consider in trading any market today.
Big Picture 3rd May 2020
In my previous piece last week, I forecasted that the best trade was likely to be short of the S&P 500 Index. Unfortunately, the S&P 500 Index rose in value by 4.08% last week.
Last week’s Forex market saw the strongest rise in the relative value of the Japanese Yen and the strongest fall in the relative value of the British Pound.
Fundamental Analysis & Market Sentiment
The world is not coming to an end, but we are living in an extraordinary time of global health crisis, the type of which has not been seen in one hundred years. There is both fear and optimism, but it is important to remember that the evidence shows that the vast majority of people are going to survive and be healthy.
We see the epicenter of the global coronavirus pandemic in the United States, especially New York, with fatalities hitting a high rate also in the U.K. The rolling average of deaths has seemed to be plateauing or even falling in both those countries, although daily new confirmed cases remain stubbornly high but are falling strongly in New York. Latin America is becoming a new epicenter, and is seeing the most dramatic rises in new deaths and confirmed infections, especially Brazil, which is now recording more daily deaths than any other nation beside the U.S.A. Latin America is now responsible for over 20% of confirmed new daily deaths, although the overall number globally continues to fall. The strongest exponential growth in new confirmed cases is happening in India, Russia, Brazil, Ecuador, Mexico, and Peru.
The number of new confirmed coronavirus cases globally hit an all-time high yesterday at almost 96,000 new cases, despite the decreasing number of deaths.
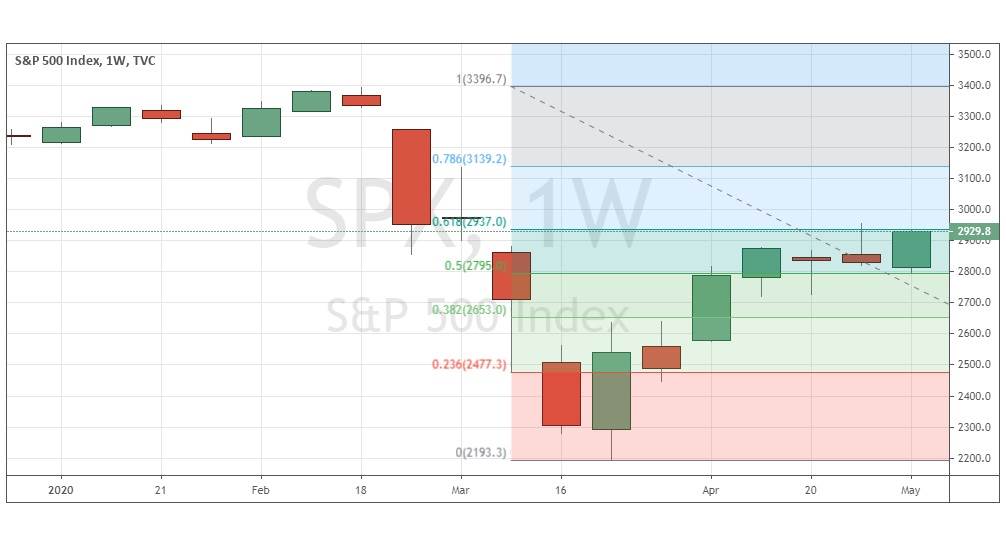
The U.S. stock market rose last week and is again approaching the 61.8% Fibonacci retracement level of its peak to trough decline seen from February to March. The market has been recovering bullishly at least partly due to the $2.2 trillion emergency stimulus package a few weeks ago and ongoing buying of U.S. stocks and other market instruments on a large scale by the Federal Reserve. However, important questions remain as to the sustainability of this rally even in the face of a huge drop in GDP and employment, which the U.S. economy is certain to suffer over the near term.
U.S. GDP shrank by 4.8% in the first quarter of 2020. U.S. unemployment nationwide is currently confirmed at 14.7%. New unemployment claims in the U.S. have hit 50 million over only the past two months. Many analysts see this ongoing stock market rise as bound to collapse, and we may be approaching a pivotal moment where bears begin to dominate again.
It is clear that as many countries seek to relax coronavirus-related restrictions to get their economies moving again, they will be hoping to be able to keep relaxing to try to secure strong economic rebounds. The only given is that employment and GDP generally will take severe hits, with Goldman Sachs forecasting a 34% drop in U.S. GDP in the second quarter of 2020. The stock market crash we have seen was comparable to 2008 and even 1929 so far. In fact, the speed of the initial drop of 20% from the all-time high price took only 15 market days to happen, compared to 30 days in 1929.
It seems clear that we will see a continuing level of high market volatility, at least in the stock market.
We are also starting to see a few countries that have had relatively successful lockdown measures begin to relax restrictions on the belief they have successfully dealt with a first wave of infections. These are smaller nations such as Denmark, Norway, Austria, Denmark, Israel and the Czech Republic. However larger and severely impacted nations such as France, Spain and Italy are also approaching a point where the disease has begun to recede, and certain relaxations are beginning. It seems likely that these countries and the U.K. will need to relax very slowly as they are so hard-hit by the disease.
Some states in the United States have also begun to relax restrictions, despite the fact that new confirmed cases are increasing in several states outside New York. Approximately 0.24% of the entire population of New York City has died from the virus in recent weeks, suggesting that the infection fatality rate truly is not far from 1% - although this is hotly disputed by many.
Technical Analysis
U.S. Dollar Index
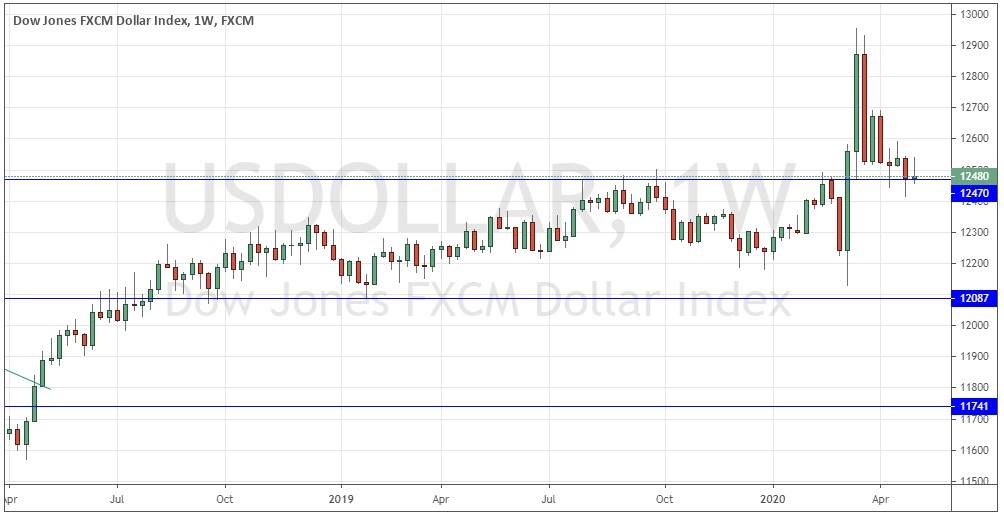
The weekly price chart below shows last week printed a bearish inside pin candlestick, and which is still holding up above the support level shown at the blue horizontal line at 12470 but is sitting right on it. The price action is somewhat bearish, but there is a long-term bullish trend reflected in the fact that the price is higher over both 3 and 6 months, but we are seeing a decline in volatility accompanied by a consolidation after very high volatility, so direction is extremely difficult to predict. Overall, next week’s price movement in the U.S. Dollar looks unpredictable but slightly more likely to be up than down.
S&P 500 Index
The major U.S. stock market index the S&P 500 Index – the biggest market index in the world – made a firm rise last week. The candlestick is a bullish engulfing candlestick, and it seems poised to test 61.8% Fibonacci retracement level at 2937 of the market’s recent peak to trough move. This price area between about 2900 and 3000 is highly likely to be pivotal, so a close at the end of this week above 2937 or 3000 would be technically significant and suggest that the recent low will not be revisited, and that the bullish market recovery would probably continue.
XAU/USD (Gold)
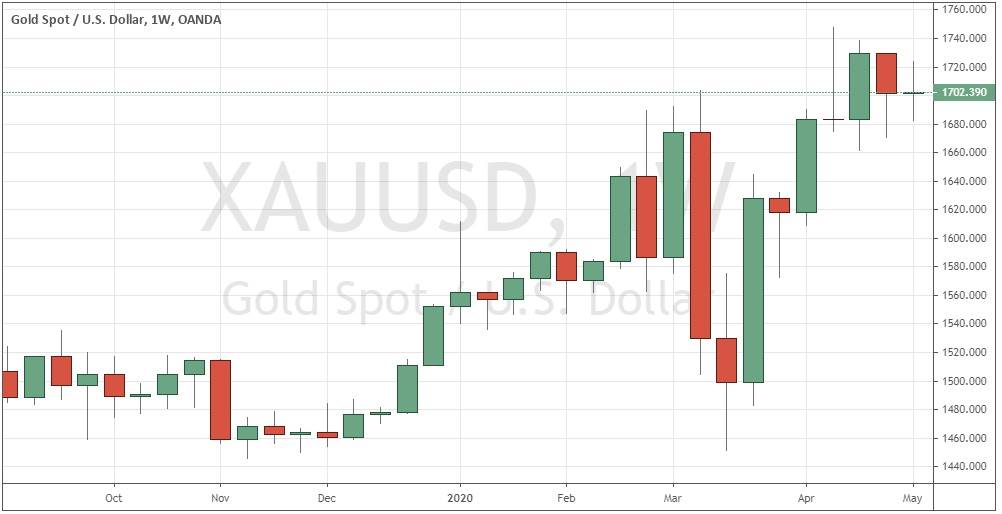
The Gold weekly chart has printed a double inside candlestick formation, with the most recent weekly candlestick a near-perfect inside doji. This strongly suggests a dramatic breakout in one direction is about to happen. We have a long-term bullish trend, so a bullish breakout seems like a more likely scenario. It is probably going to be most fruitful to wait for the breakout to be confirmed, so I would wait for a daily (New York close) above $1730 an ounce before entering any long trade here.
Conclusion
This week I forecast the best trade is likely to be long of Gold in U.S. Dollar terms following a daily (New York) close above $1730 per ounce.


