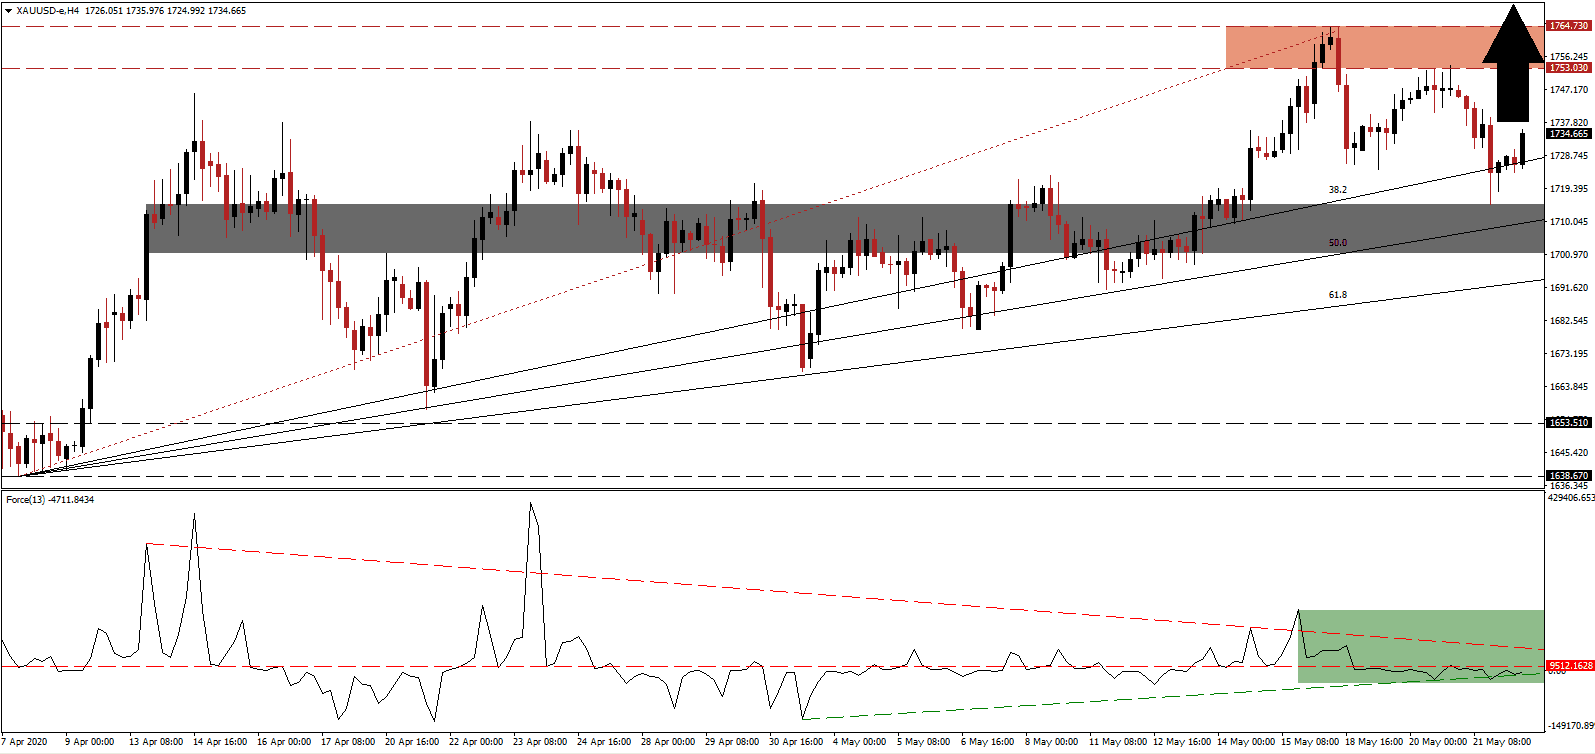
While economies are gradually lifting nationwide lockdowns, the World Health Organization reported a daily record in new confirmed Covid-19 cases, exceeding 100,000. It serves as a reminder that the global pandemic is not contained, treatments have not been identified, and the threat of a second infection wave over the summer months cannot be ignored. Since epidemiology and economics are intertwined, new models suggest a hybrid method marks the most efficient path forward. Best results were achieved by implementing a 50-day nationwide lockdown followed by 30 days of relaxed rules with social distancing enforced. With the ongoing pandemic expected to force permanent changes to consumer behavior, gold is well-positioned to accelerate to a new 2020 high after bouncing off the top range of its short-term support zone.
The Force Index, a next-generation technical indicator, retreated from its most recent peak and moved below its horizontal support level, converting it into resistance. Bearish momentum faded quickly after the Force Index reached its ascending support level, as marked by the green rectangle. A new push to the upside is pending, anticipated to eclipse the descending resistance level. Until this technical indicator crosses above the 0 center-line, bulls are in a waiting pattern to regain control of price action in gold.
Adding to long-term bullish developments for gold is the new spike in global debt, the preferred response by most governments. While several emerging markets attempted fiscal responsibility, the majority of developed economies set course for debt-to-GDP ratios to exceed 100%. Market participants currently ignore the economic fallout of a global debt crisis, creating ideal conditions for this precious metal, the primary safe-haven asset, to extend its breakout. Gold advanced after challenging the top range of its short-term support zone located between 1,701.06 and 1,714.79, as marked by the grey rectangle.
Gold is on track to record a new 2020 high, partially boosted by the destructive monetary policy of the US that weakening its currency, which enjoys an inverse relationship to this precious metal. The ascending 38.2 Fibonacci Retracement Fan Support Level is providing additional upside pressure. Price action is favored to move into its resistance zone located between 1,753.03 and 1,764.73, as identified by the red rectangle. A breakout extension is probable, fueled by further monetary policy missteps by central banks. The next resistance zone is located between 1,814.45 and 1,827.35, while a surge past the key psychological $2,000 mark, and a new all-time high, is possible.
Gold Technical Trading Set-Up - Breakout Extension Scenario
Long Entry @ 1,735.00
Take Profit @ 1,825.00
Stop Loss @ 1,710.00
Upside Potential: 9,000 pips
Downside Risk: 2,500 pips
Risk/Reward Ratio: 3.60
A breakdown in the Force Index below its ascending support level can pressure gold into a renewed push to the downside. With a dominant bullish chart pattern confirmed, and increasing ignorance towards the ongoing threats of the global Covid-19 pandemic, the downside potential is reduced to the 61.8 Fibonacci Retracement Fan Support Level. It will offer traders an excellent long-term buying opportunity.
Gold Technical Trading Set-Up - Reduced Breakdown Scenario
Short Entry @ 1,704.00
Take Profit @ 1,692.00
Stop Loss @ 1,710.00
Downside Potential: 1,200 pips
Upside Risk: 600 pips
Risk/Reward Ratio: 2.00

