Retail traders have pushed equity markets off of the March low, but trading volume remains thin, implying institutional capital is in a holding pattern on the sideline. Gold, the primary safe-haven asset, maintains its dominant bullish chart formation, suggesting a healthy inflow backed by stable demand, including central bank buying. With the mutating Covid-19 virus and a gradual easing of lockdown measures, the likelihood of a second wave of infections and selling across financial markets increased over the past two weeks. It adds a distinct bullish catalyst to this precious metal, presently situated just below its resistance zone.
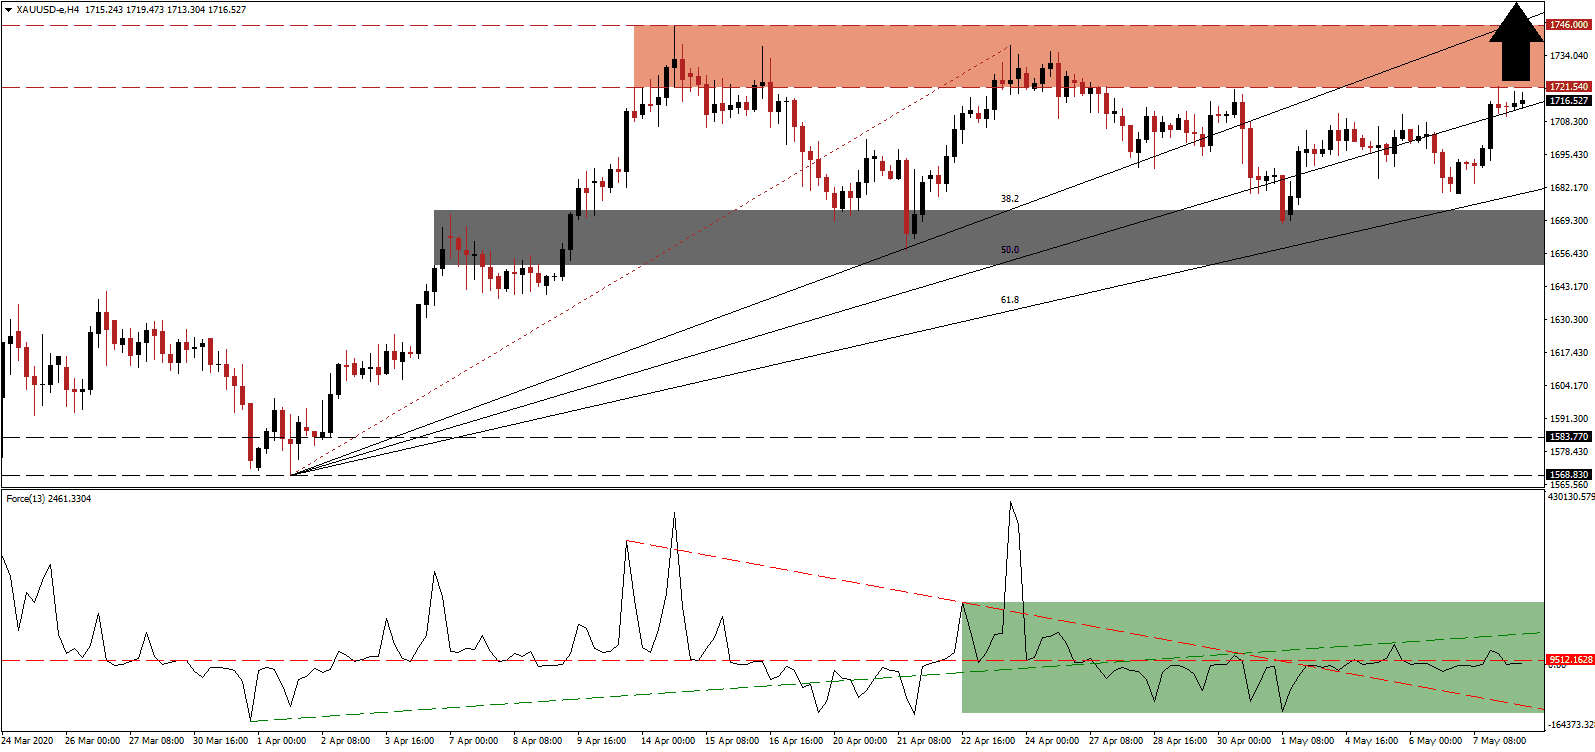
The Force Index, a next-generation technical indicator, flatlined after the ascending support level and the descending resistance level reversed roles. It is trading above and below its horizontal resistance level, as marked by the green rectangle, with a widening range. Bulls are in control of gold with this technical indicator above the 0 center-line. Ongoing fundamental developments favor an acceleration of the Force Index to the upside, generating additional bullish pressures on price action.
While this precious metal entered a sideways trend, the bullish bias is enforced by a series of higher lows. It results in the upward adjustment of the short-term support zone, presently located between 1,651.52 and 1,673.12, as marked by the grey rectangle. Economic data around the world highlights a significantly more dire situation than governments and policymakers assumed. Tremendous costs of stimuli and bailouts are unsustainable, adding to an already damaging global debt load. Today’s US NFP report may provide the next short-term catalyst for a breakout extension in gold.
Increasing upside pressure is the ascending Fibonacci Retracement Fan sequence, after the 38.2 Fibonacci Retracement Fan Resistance Level eclipsed the resistance zone located between 1,721.54 and 1,746.00, as identified by the red rectangle. US President Trump threatens more tariffs on China, and Australia started a diplomatic spat with its biggest trading partner, adding to global trade worries, which are already depressed due to the global Covid-19 pandemic. Gold is well-positioned to advance into its next resistance zone between 1,795.85 and 1,814.45, dating back to August 2011.
Gold Technical Trading Set-Up - Breakout Extension Scenario
Long Entry @ 1,717.00
Take Profit @ 1,814.00
Stop Loss @ 1,697.00
Upside Potential: 9,700 pips
Downside Risk: 2,000 pips
Risk/Reward Ratio: 4.85
A rejection in the Force Index by its ascending support level, serving as temporary resistance, is likely to result in a brief sell-off in gold. The downside potential remains confined to the bottom range of its short-term support zone. With retail traders active in financial markets, as institutional capital awaits the end of their supply cycle, a more violent sell-off is favored to pressure this precious metal to new 2020 highs. Traders are advised to buy the dips moving forward, with the long-term outlook increasingly bullish.
Gold Technical Trading Set-Up - Confined Breakdown Scenario
Short Entry @ 1,687.00
Take Profit @ 1,664.00
Stop Loss @ 1,697.00
Downside Potential: 2,300 pips
Upside Risk: 1,000 pips
Risk/Reward Ratio: 2.30

