BTC/USD: $9,000 area will be pivotal
Last Thursday’s signals were not triggered, as there was no bullish price action at any of the support levels which were reached.
Today’s BTC/USD Signals
Risk 0.50% per trade.
Trades must be taken before 5pm Tokyo time Tuesday.
Long Trade Ideas
- Go long after a bullish price action reversal on the H1 time frame following the next touch of $8,162.
- Put the stop loss $50 below the local swing low.
- Adjust the stop loss to break even once the trade is $50 in profit by price.
- Take off 50% of the position as profit when the trade is $50 in profit by price and leave the remainder of the position to ride.
Short Trade Ideas
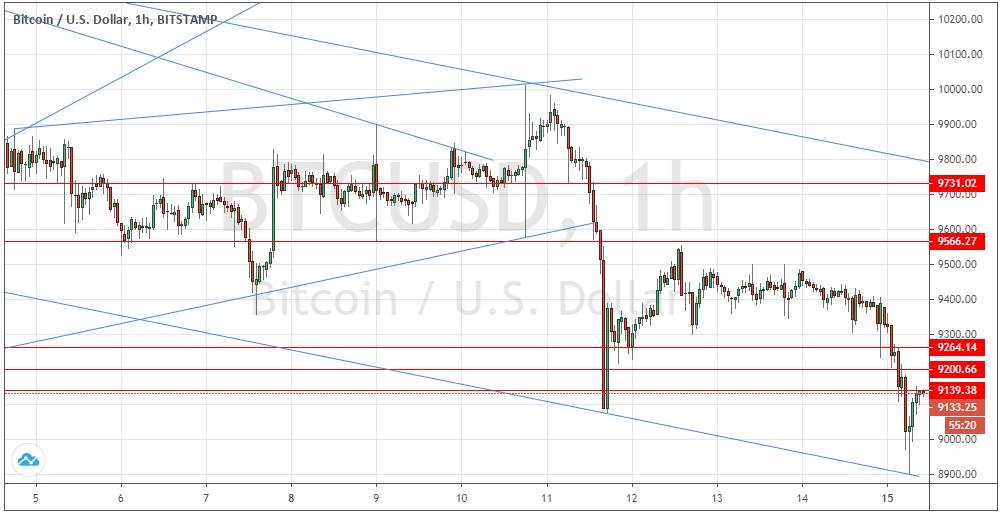
- Go short after a bearish price action reversal on the H1 time frame following the next touch of $9,200, $9,264, or $9,566.
- Put the stop loss $50 above the local swing high.
- Adjust the stop loss to break even once the trade is $50 in profit by price.
- Take off 50% of the position as profit when the trade is $50 in profit by price and leave the remainder of the position to ride.
The best method to identify a classic “price action reversal” is for an hourly candle to close, such as a pin bar, a doji, an outside or even just an engulfing candle with a higher close. You can exploit these levels or zones by watching the price action that occurs at the given levels.
BTC/USD Analysis
I wrote last Thursday that the picture was fairly bullish, and I was looking to take a long trade from either a bounce at any support level or if the price could get established above $10,000. Neither of these scenarios played out.
The strong increase in risk-off sentiment sent the price of Bitcoin crashing down last Thursday, which is not surprising, as Bitcoin typically and ironically acts as the opposite of a safe haven.
Technically, the strong move down invalidated all the support levels, but a few hours ago we saw a bullish bounce at $9,000. This is effectively support and is likely to be a pivotal level, meaning that if the price can break down further below it, the technical picture will get much more bearish.
Another new technical factor is the new wide but symmetrical bearish price channel shown in the chart below. The lower trend line of this channel is currently sitting at about $8,900 which is quite confluent with the round number mentioned earlier at $9,000 which reinforces the importance of this level.
I am prepared to take a bearish bias here later if we get two consecutive hourly closes below the lower trend line of the bearish price channel.
Regarding the USD, there is nothing of high importance scheduled for today.

