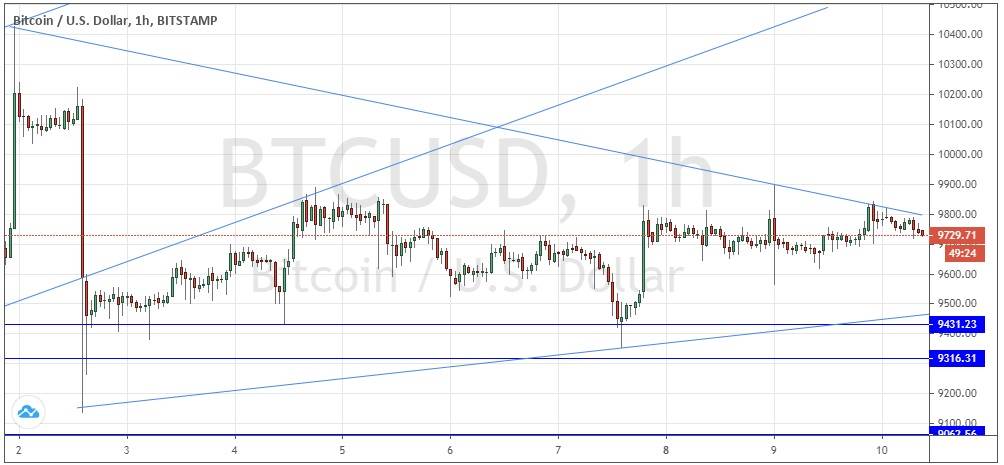
BTC/USD: Narrowing triangle above strongly supportive area
Yesterday’s signals were not triggered, as none of the key levels were reached yet.
Today’s BTC/USD Signals
Risk 0.50% per trade.
Trades must be entered prior to 5pm Tokyo time Thursday.
Long Trade Ideas
- Go long after a bullish price action reversal on the H1 time frame following the next touch of $9,431, $9,316 or $9,063.
- Put the stop loss $50 below the local swing low.
- Adjust the stop loss to break even once the trade is $50 in profit by price.
- Take off 50% of the position as profit when the trade is $50 in profit by price and leave the remainder of the position to ride.
Short Trade Ideas
- Go short after a bearish price action reversal on the H1 time frame following the next touch of $10,696.
- Put the stop loss $50 above the local swing high.
- Adjust the stop loss to break even once the trade is $50 in profit by price.
- Take off 50% of the position as profit when the trade is $50 in profit by price and leave the remainder of the position to ride.
The best method to identify a classic “price action reversal” is for an hourly candle to close, such as a pin bar, a doji, an outside or even just an engulfing candle with a higher close. You can exploit these levels or zones by watching the price action that occurs at the given levels.
BTC/USD Analysis
I wrote yesterday that there was no change to the ongoing technical picture– bullish as long as $9,316 or even $9,000 holds as support, bearish below $9,000. However, I did note that the price was being held by a narrowing triangle, which is shown in the price chart below.
This situation continues for yet another day, with the narrowing triangle continuing to hold the price as resistance over recent hours.
The only new item I can add is that there will have to be a breakout from this triangle soon, as the price is approaching the endpoint where the trend lines intersect. The triangle is symmetric and obvious, so I believe it is likely to have an effect upon the price when the breakout finally happens.
There seems to be more potential in a bullish breakout than in a bearish breakdown, due to the cluster of three support levels below, and the fact that the price has plenty of room to rise above in the absence of any nearby resistance levels.
I am prepared to take a bullish bias today if either there is a bullish bounce at any support level below the triangle, or if we get two consecutive hourly closes above the upper trend line of the triangle. Ideally, this will be after the FOMC releases due later, as these can affect the value of the USD dramatically.
A sustained break below $9,000 will cause me to take a bearish bias.
Regarding the USD, there will be a release of CPI (inflation) data at 1:30pm London time, followed by the FOMC Projections, Federal Funds Rate, and Statement at 7pm, followed by the usual press conference half an hour later.

