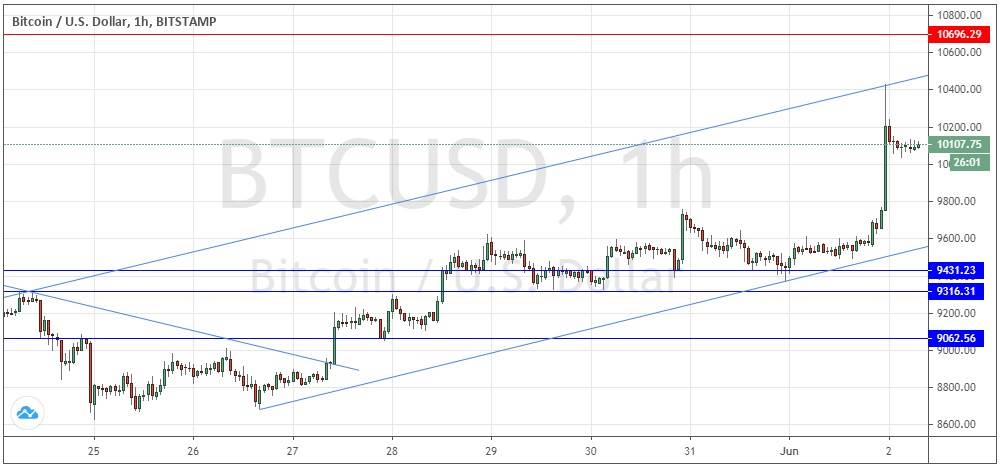
BTC/USD: New 3-month high price reached
Yesterday’s signals were not triggered, as the bearish price action took place above the resistance level at $10,130.
Today’s BTC/USD Signals
Risk 0.50% per trade.
Trades may only be entered before 5pm Tokyo time Wednesday.
Long Trade Idea
Long entry after a bullish price action reversal on the H1 time frame following the next touch of $9,431.
Place the stop loss $50 below the local swing low.
Move the stop loss to break even once the trade is $50 in profit by price.
Remove 50% of the position as profit when the trade is $50 in profit by price and leave the remainder of the position to run.
Short Trade Idea
Go short after a bearish price action reversal on the H1 time frame following the next touch of $10,696.
Place the stop loss $50 above the local swing high.
Move the stop loss to break even once the trade is $50 in profit by price.
Remove 50% of the position as profit when the trade is $50 in profit by price and leave the remainder of the position to run.
The best method to identify a classic “price action reversal” is for an hourly candle to close, such as a pin bar, a doji, an outside or even just an engulfing candle with a higher close. You can exploit these levels or zones by watching the price action that occurs at the given levels.
BTC/USD Analysis
I wrote yesterday that the price had plenty of room to rise all the way to $10,000 with no obvious key resistance until that area was reached, and I was looking for a long trade from the nearest support level. This was a good call, as the price rose quite sharply to trade well above $10,000 and hit a new 3-month high price.
The technical picture is clearly bullish and showing a long-term bullish trend, in the same way that many assets are trading within long-term bullish trends against the U.S. Dollar, which has been weakening significantly. Improved risk sentiment also helps boost Bitcoin generally.
The price yesterday broke bullishly out of its ascending price channel, but we can just readjust the upper trend line a bit higher to keep the symmetry of the channel, so we have a new adjusted channel which is drawn within the price chart below.
The former resistance level identified at $10,130 which has been effective for a long time, has been invalidated, giving the price more room to rise.
The action still looks bullish over the short-term, so higher prices over the course of today are a bit more likely than lower prices. There is nothing of high importance due today concerning the USD.
