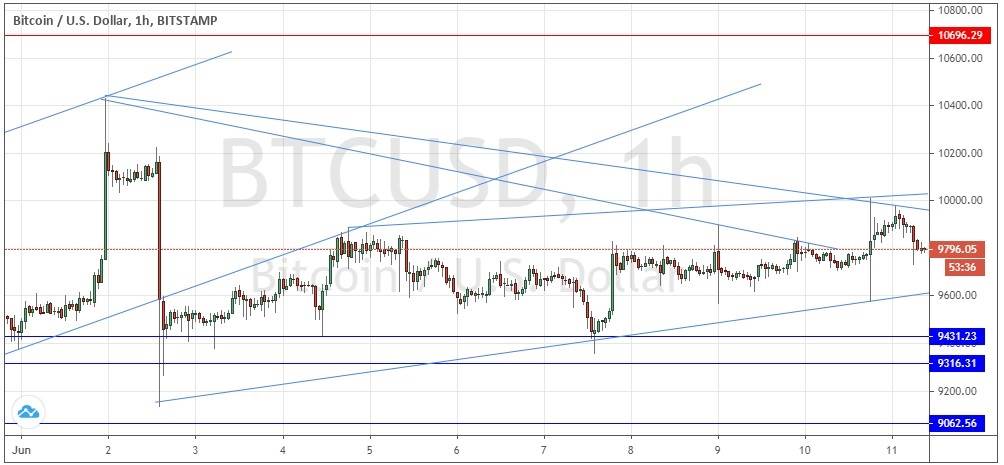
BTC/USD: Price sitting above strongly supportive area
Yesterday’s signals were not triggered, as none of the key levels were reached.
Today’s BTC/USD Signals
Risk 0.50% per trade.
Trades may only be taken prior to 5pm Tokyo time Friday.
Long Trade Ideas
- Long entry after a bullish price action reversal on the H1 time frame following the next touch of $9,431, $9,316 or $9,063.
- Place the stop loss $50 below the local swing low.
- Move the stop loss to break even once the trade is $50 in profit by price.
- Remove 50% of the position as profit when the trade is $50 in profit by price and leave the remainder of the position to run.
Short Trade Ideas
- Short entry after a bearish price action reversal on the H1 time frame following the next touch of $10,696.
- Place the stop loss $50 above the local swing high.
- Move the stop loss to break even once the trade is $50 in profit by price.
- Remove 50% of the position as profit when the trade is $50 in profit by price and leave the remainder of the position to run.
The best method to identify a classic “price action reversal” is for an hourly candle to close, such as a pin bar, a doji, an outside or even just an engulfing candle with a higher close. You can exploit these levels or zones by watching the price action that occurs at the given levels.
BTC/USD Analysis
I wrote yesterday that I was prepared to take a bullish bias if there was either a bullish bounce at any support level below the triangle, or if we got two consecutive hourly closes above the upper trend line of the triangle. Ideally, this would be after the FOMC releases.
This was a good call as we got two-hourly closes above the triangle just after the FOMC release, and the price rose from there before falling back. Unfortunately for bulls, this breakout was not strong, and admittedly the signal would now be in a floating loss, but not a confirmed loss yet.
The technical picture is now a little more bullish. We had a bullish breakout from the old triangle but now there is a new triangle containing the price. However, we have also a bullish channel now, although the channel is not symmetrical so probably not very reliable.
I will take a long trade from a bullish bounce at any of the support levels identified above, or if we get two consecutive hourly closes above $10,000 later. This key round number is confluent with the highest trend line, as shown in the chart below.
Regarding the USD, there is nothing of high importance scheduled for today.

