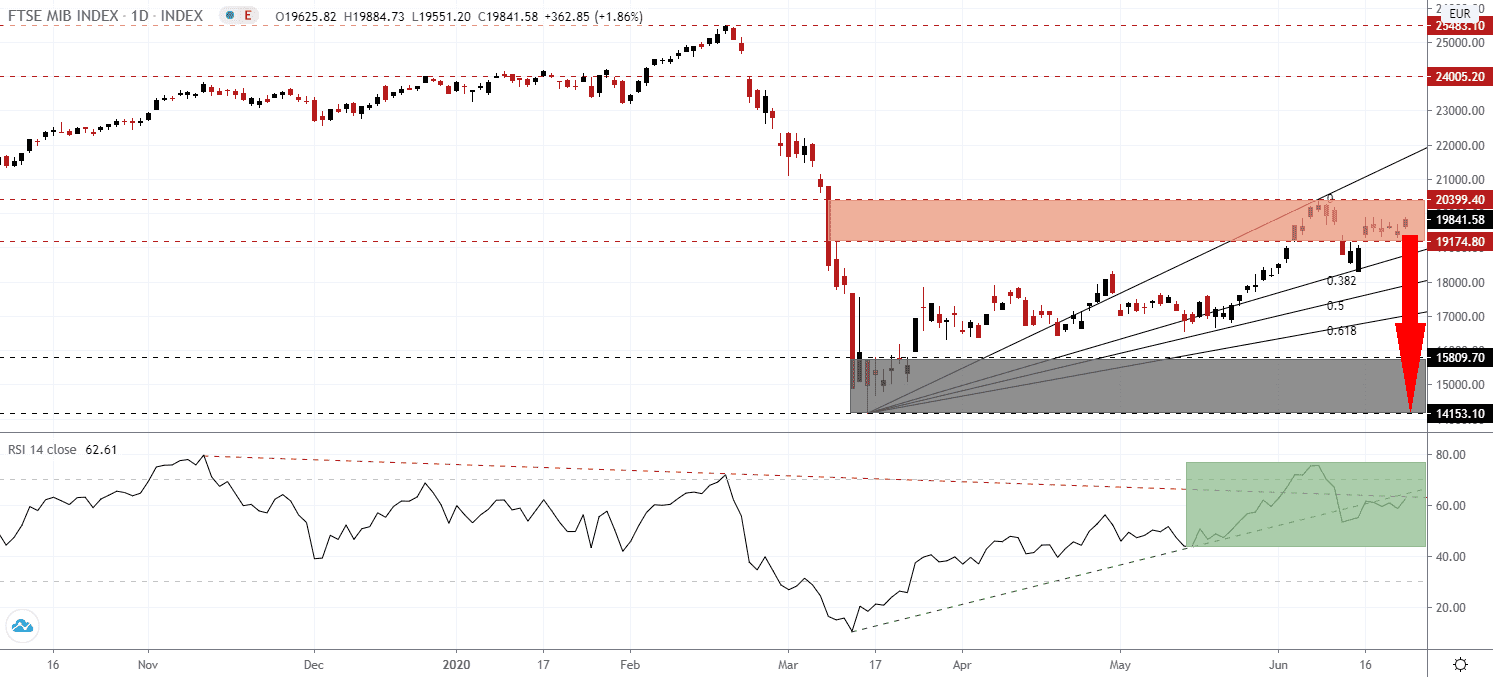
Covid-19 infections continue to rise, with North and South America accounting for the most significant increase. Italy was the first major European economy to face a devastating scenario where a lack of preparation and ignorance of warnings by healthcare officials resulted in the first nationwide lockdown. The experiment quickly became the norm around the world. Governments and central banks attempt to cushion recessionary threats with more debt-funded stimulus packages, fueling the next global financial crisis. After the FTSE MIB utilized its ascending 38.2 Fibonacci Retracement Fan Support Level to reverse back into its short-term resistance zone, breakdown pressures have expanded once again.
The Relative Strength Index, a widely used technical indicator to identify overbought and oversold conditions, moved back into overbought territory above 60.0. It now faced with its descending resistance level, as marked by the green rectangle, likely to prevent an extended move into extreme conditions above 70.0. The breakdown below its ascending support level is adding to downside pressures, with bears in firm control of price action in the FTSE MIB.
Italy faces a significant equity shortfall due to the excessive short-term liquidity granted via debt. The increased leverage exposure is raising the default risk of companies, especially if the global economy falls short of lofty forecasts. It also reduces the potential for companies to invest and grow their operations, diminishing GDP growth potential, and feeding a downward spiral. The FTSE MIB created a lower high inside of its short-term resistance zone located between 19,174.8 and 20,399.40, as identified by the red rectangle. It represents a bearish development, adding to the pending breakdown in this equity index.
Calls for direct government equity injections have increased, which may partially nationalize essential firms and sectors. While select large-cap companies are likely to raise the required equity in financial markets and restructure their debt, the bulk of distressed names are deprived of this option. Direct government equity injections will provide another short-term policy error while expanding long-term problems. A potential second wave of Covid-19 infections remains a viable risk. The FTSE MIB is ideally positioned to renew its correction with a breakdown below its 38.2 Fibonacci Retracement Fan Support Level. The next support zone is located between 14,153.1 and 15,809.7, as marked by the grey rectangle.
FTSE MIB Technical Trading Set-Up - Breakdown Scenario
Short Entry @ 19,840.0
Take Profit @ 14,155.0
Stop Loss @ 21,150.0
Downside Potential: 56,850 pips
Upside Risk: 13,100 pips
Risk/Reward Ratio: 4.34
In the event the RSI crosses above its descending resistance level, the FTSE MIB could be inspired into a push higher. With ongoing disagreements between Rome and Brussels regarding the Italian budget, setting the Eurozone’s third-largest economy on track for a 2020 debt-to-GDP ratio of 155.7%, any price spike should be considered a selling opportunity. The upside potential is confined to its 61.8 Fibonacci Retracement Fan Resistance Level, approaching 23,000.
FTSE MIB Technical Trading Set-Up - Confined Breakout Scenario
Long Entry @ 21.840.0
Take Profit @ 23,000.0
Stop Loss @ 21,150.0
Upside Potential: 11,600 pips
Downside Risk: 6,900 pips
Risk/Reward Ratio: 1.68


