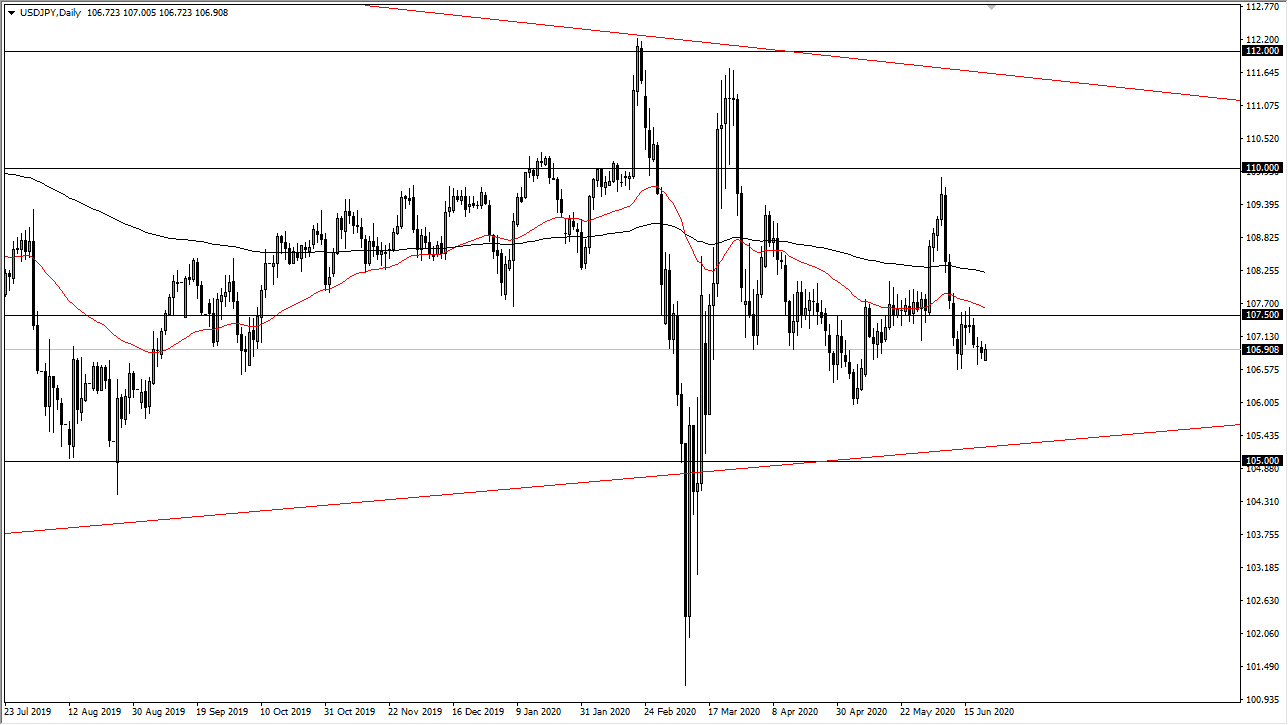
The US dollar gapped a bit lower during the trading session on Monday, but then turned around to fill that gap. After that, nothing happened as the markets were noticeably quiet once New York started trading stocks. Ultimately, this is a market that is going nowhere and I cannot stand trading it anymore. The longer-term chart suggests that we are going to have a major breakout someday, but that day is not now, nor is it anytime soon from what I have seen. Because of this, I have to use this pair as a measuring stick for strength or weakness when it comes to the Japanese yen itself and trade other markets as a result.
For example, if this pair falls then I am looking for the other pairs that are related to the Japanese yen to fall as well. I might do something like short the GBP/JPY pair, AUD/JPY pair, etc. However, if this pair rallies then I am looking to do the exact opposite in markets like that. One of the biggest problems we have with this pair right now is both of these are considered to be “safety currencies”, and therefore it is likely that the market will chop back and forth. We have been in a range for what seems like a lifetime, and therefore I hardly ever actually look at this chart for a trade.
If you are a short-term day trader, you may be able to trade back and forth around the ¥107.50 level, an area that has attracted a lot of price action. In that scenario, you will be looking to buy and sell on something like the five minute chart, because that is about as involved in this market that you should be looking at. Looking at the candlestick for the day, it does not really tell you much other than the market did not want to break down. It does not exactly want to break up either so at this point in time I think the 107.50 level is about as far as we go not only due to the fact that it has been historically significant, but also the fact that it also features the 50 day EMA, which of course will attract a certain amount of attention as it is a major technical indicator. It should be pointed out that the 50 day EMA and the 200 day EMA are relatively flat so that shows just how lackluster the market really has been.


