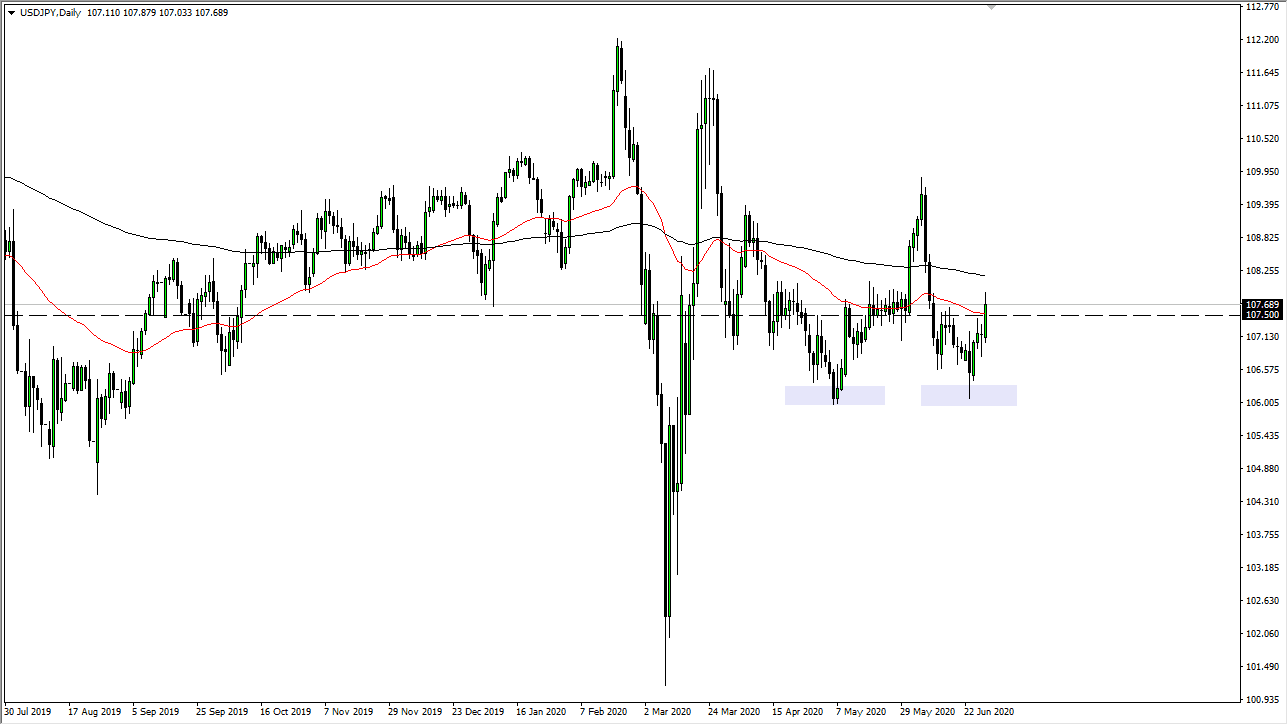
The US dollar has rallied a bit against the Japanese yen during the trading session on Monday, as we have seen a bit of US dollar strength in general. The ¥107.50 level has been a bit of a target, and it should not be a huge surprise that we have reached in that area. The 50 day EMA is a technical indicator the people pay attention to, just as the 200 day EMA is as well, which is above there. With that being the case, the market is likely to see a lot of interest, so therefore do not be surprised at all to see this market pullback from this region, because it has been an area that has caused a bit of noise in the past.
If we do break above the 200 day EMA, then the market is likely to go much higher, perhaps reaching towards the ¥110 level. The alternate scenario of course is the pullback from this area and reach down towards the ¥106 level again. That is an area that has been a little bit of a double bottom, so at this point in time it would not be surprising at all to see the market find that supportive again. Looking at this chart, this is an area that will course be crucial. If we break down below there, then it is likely that the market goes looking towards the ¥105 level.
The 50 day EMA and the 200 day EMA both are starting to slope a little bit to the downside, so it looks as if the market is going to continue to find plenty of sellers. All things being equal, this is a market that I think continues to go back and forth trying to find a longer-term move. When you zoom way out on this pair, there is a bit of a symmetrical triangle, and we are trying to figure out which way to go further down the line. Keep in mind that this pair is likely to continue to react to the overall attitude of risk appetite as the Japanese yen is considered to be the “safest currency” in general. This pair typically will go up or down right along with the S&P 500, but at this point both of these markets have a little bit of noise above that could cause some issues.


