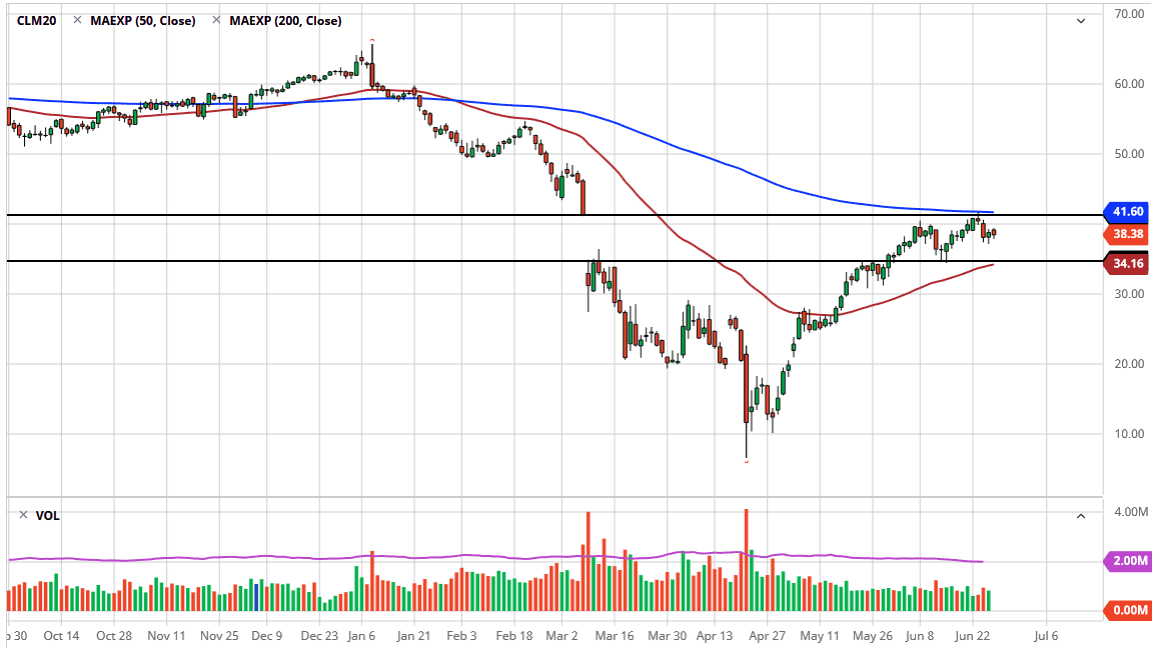
The West Texas Intermediate Crude Oil market fell a bit during the trading session on Friday but remains within the range of the Thursday session. Looking at the chart, the $41 level above is a significant resistance barrier in the form that the top of the gap sits right there. Beyond that, the 200 day EMA is sitting just above that level so I think it is likely that we will continue to see sellers in that general vicinity. Now that we have filled the top of the gap, I suspect that the next move is going to be trying to find some type of range from which to trade back and forth which is the typical behavior of this market.
Looking at this chart, it is likely that we will see a range trying to form between the $40 level above, and quite possibly the $30 level below. Between here and there, I do recognize that the $35 level could offer support based upon the 50 day EMA and the fact that it is at the bottom of the gap, so we may end up forming a little bit tighter than the usual range. If that were to be the case, then it is likely we will see an explosive move sooner or later.
Ultimately, this is a market that I think will make a decision for a bigger move, but right now we are starting to look at the supply and demand equation with a little bit more scrutiny than the previous trading had shown. After all, we had OPEC start cutting, and the lack of production suggests that price would go higher due to supply rolling off. However, supply is still extraordinarily strong so it is likely that we will have a bit of a roof in the market anyway.
If we were to break above the 200 day EMA on a daily close, then I believe the market will probably go looking towards the $49 level next. This does not seem highly likely to happen, but it is a potential opportunity if we do get a break above that 200 day EMA. I expect a lot of choppiness, but ultimately this is a market that is close to making a bigger decision so paying attention to some type of impulsive candlestick is important for a longer-term type of set up. Until then, I trade back and forth between these two major moving averages in the form of the 50 and the 200 day EMAs.


