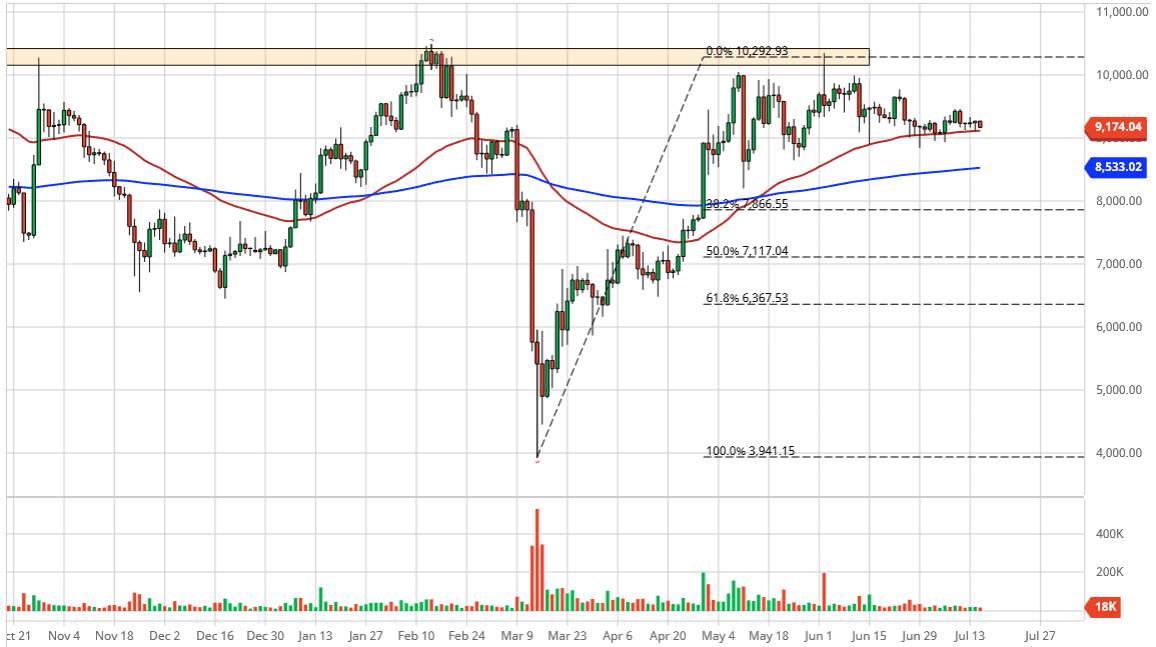
The bitcoin markets fell slightly during the trading session on Wednesday, losing about $100. However, we still sit above the 50 day EMA which is an especially important technical indicator when it comes to the Bitcoin markets, as you can see from the previous trading. Ultimately, I think this market will find buyers, but we may have to kill a bit of time in this general vicinity. Not only do we have the 50 day EMA here, but we also have several wicks that suggest every time we drop towards the $9000 level, there are buyers. After that, you have the 200 day EMA and a lot of times the area between the 50 and the 200 EMA offers a zone of support or resistance.
To the upside, I see several different minor barriers, but longer-term the move is almost certainly towards the 10,000 handle. The 9400 level is the first short-term resistance barrier, followed by the $9750 level. Unfortunately, the $10,000 level is not that simple. It actually extends about $500 higher as it is more or less a zone than a level. If we could clear that level, then Bitcoin would more than likely make a move towards the $12,000 level.
Even if you are bullish on Bitcoin, you must admit that there are long periods of time where the market simply does nothing. Unfortunately, we are in one of those times now, where we are looking for some type of catalyst. On the bearish side, bitcoin has not taken advantage of what has been an extreme US dollar weakness. If it is not can it take advantage of that, the question then becomes “When will it?” The move that we have seen up to this level was based upon the happening, which came and went with hardly any fanfare at all.
If we break down below the 200 day EMA which is currently parked at the $8533 level, then I think we could have a significant breakdown. That would probably lead to a move down towards the 50% Fibonacci retracement level at the psychologically and structurally important $7000 level. In the short term though, I still think that buying pullbacks probably makes the most amount of sense on short-term charts. Until we get some type of impulsive candle, the market will probably continue the same type of lackluster performance.

