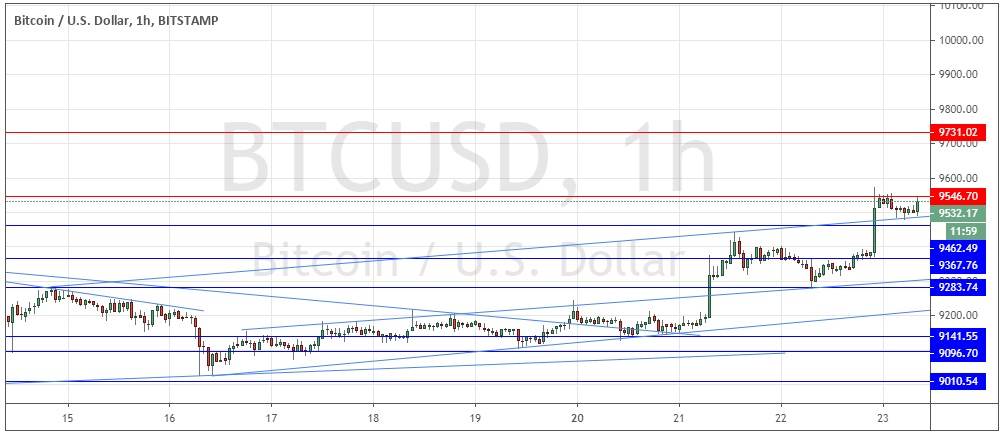
BTC/USD: Bulls finally overcoming key resistance hurdles below $10,000
Yesterday’s signals produced a profitable long trade from the bullish bounce off the support level identified at $9,284.
Today’s BTC/USD Signals
Risk 0.50% per trade.
Trades may only be entered prior to 5 pm Tokyo time Friday.
Long Trade Ideas
- Long entry after a bullish price action reversal on the H1 time frame following the next touch of $9,462, $9,368, or $9,284.
- Place the stop loss $50 below the local swing low.
- Move the stop loss to break even once the trade is $50 in profit by price.
- Remove 50% of the position as profit when the trade is $50 in profit by price and leave the remainder of the position to run.
Short Trade Ideas
- Short entry after a bearish price action reversal on the H1 time frame following the next touch of $9,731.
- Place the stop loss $50 above the local swing high.
- Move the stop loss to break even once the trade is $50 in profit by price.
- Remove 50% of the position as profit when the trade is $50 in profit by price and leave the remainder of the position to run.
The best method to identify a classic “price action reversal” is for an hourly candle to close, such as a pin bar, a doji, an outside or even just an engulfing candle with a higher close. You can exploit these levels or zones by watching the price action that occurs at the given levels.
BTC/USD Analysis
I wrote yesterday that a worrying sign for bulls was that the price was below an obvious new resistance level at $9,331.
However, I thought the technical picture was still at least a little bullish, due to the wide ascending price channels still dominant in the chart.
I only wanted to be taking long positions in Bitcoin either at a firm bullish bounce near $9,000 or following a bullish breakout above the psychologically important round number at $10,000.
Neither of my conditions were satisfied, but the price did bounce nicely yesterday at the support level which I had identified at $9,284, giving a potential long trade which turned out to be very profitable if taken.
The technical picture now is significantly more bullish. The price has broken above both its bullish price channel, and above significant, long-term key resistance levels, and is now taking a pause just below the resistance level at $9,546.
If the price can get established above $9,546 that would be a bullish sign, so I will take a bullish bias here if we get two consecutive hourly closes above that level later.
I would only be interested in taking a short trade as a scalp at first touch of the higher resistance level at $9,731.
There is nothing of high importance scheduled today regarding the USD.

