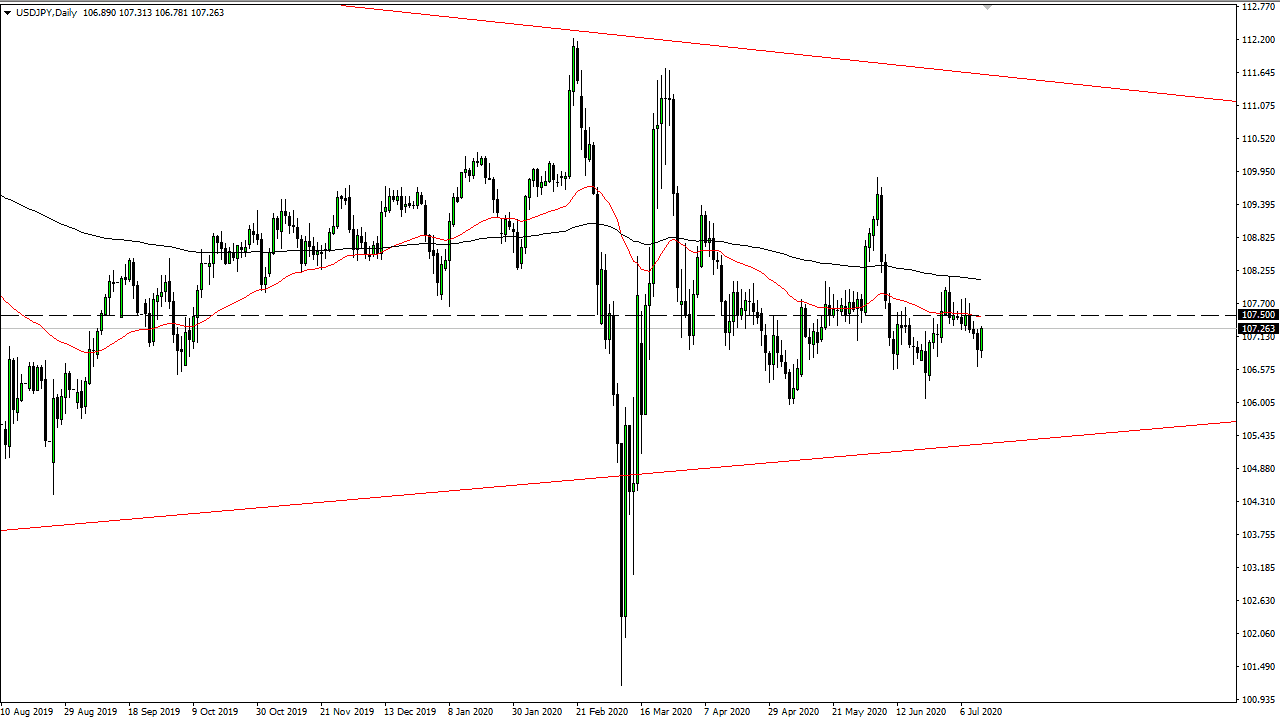
The US dollar has rallied slightly during the trading session on Monday, as we continue to see the ¥107.50 level act as a bit of magnet for price. This is an area that has been tested in both directions as of late, and therefore one has to think of it as “fair value”, or at least the closest thing to dictating that price we have available. I think at this point we also have to look at the moving averages, as I have the red 50 day EMA and the black 200 day EMA both plotted on the chart. The area between this to moving averages seems to be very resistive, and we are approaching it. I suspect that we will see this market trying to test the 50 day EMA, only to fail either there or shortly thereafter to race higher.
This is a pair that is quite often influenced by the stock market, so do not be surprised at all to see it fluctuate with the S&P 500 but that correlation has broken down a bit as of late, so I wouldn’t read so much into it. There are a lot of people out there looking to the Japanese yen for safety at times, so that could come into play as well, but you need to keep in mind that both of these currencies are considered to be safety currencies. In other words, it seems very unlikely that one is certainly going to skyrocket against the other as the entire world tries to dump their own currencies in favor of safety in one of these assets.
Longer-term, when you look at the chart you can make out that there is a bit of a long-term triangle, but we are at roughly in the middle of it, so I do not have much to say about that quite yet. If we do break down from here and continue to find resistance near the ¥107.50 level, then an attempt to get down to the ¥106 level makes quite a bit of sense. On the other hand, if we were to break above the 200 day EMA it could open up the door to the ¥110 level above which was the most recent resistance barrier. All things being equal, this is a pair that is probably going to be choppy with a little bit more of a downward bias than anything else.


