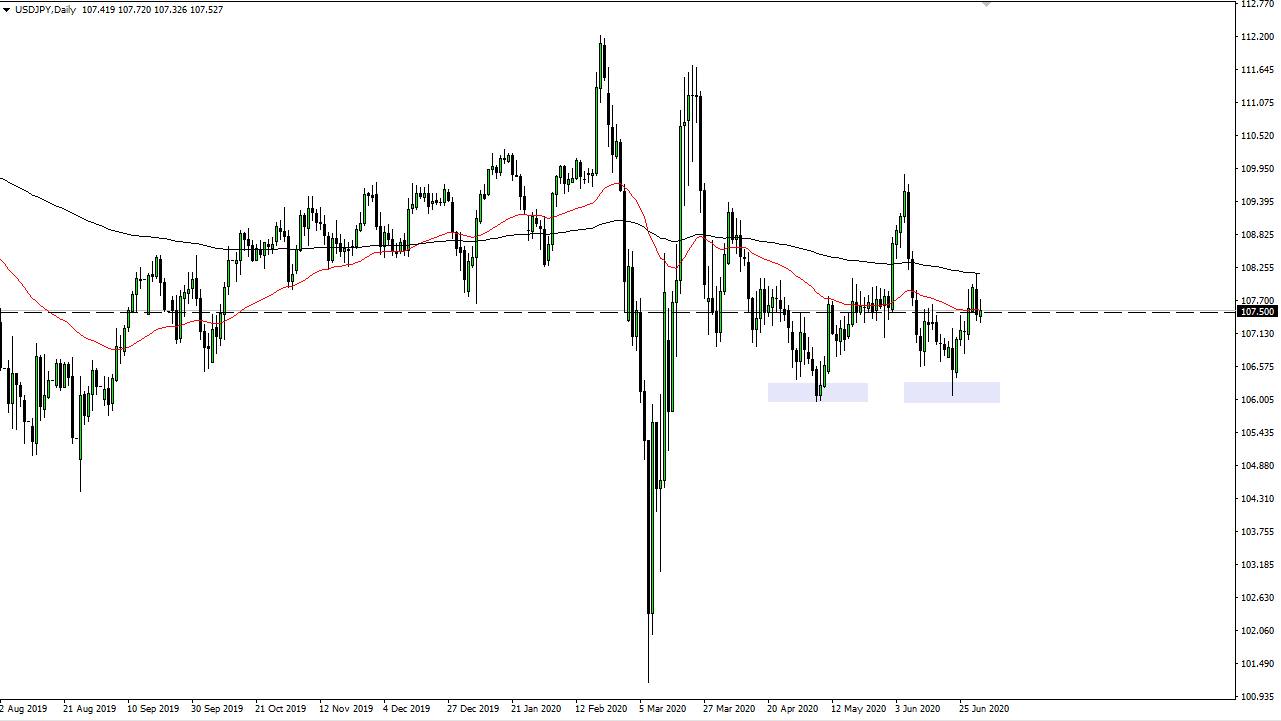
The US dollar rallied a bit during the trading session on Thursday as the market is to find the ¥107.50 level as a bit of a magnet for price. In fact, it is almost as if we are trading with some type of the Bollinger Band indicator, with the ¥107.50 level being the median price. I do think that to the downside we see a significant amount of support at the ¥106 level, which is an area that has shown a lot of support in the past and has even formed a bit of a “double bottom.”
The 50 day EMA has offered a bit of resistance during the day on Thursday, and then the 200 day EMA has also offered resistance previously. They are both sloping ever so slightly to the downside, and therefore I think that the area between the 50 day EMA and the 200 day EMA will continue to cause some issues. To the upside, if we were to break through all of that then the ¥110 level is a massive resistance region that I think would take a major announcement or shift in thinking in order to make that get busted.
At this point in time, I think that the market continues to see a lot of choppy behavior and at this point in time I think that the market is likely to see a “reversion to the mean” as we have seen time and time again as of late. I have no interest in trying to get too cute with this market and I think that if we get roughly 100 pips away from that level, then we will probably return and therefore you could have an opportunity to trade. As far as a longer-term trade is concerned, we simply do not have the set up quite yet, as the market is simply grinding away but if we finally break down below the ¥106 level, the market probably goes down to the ¥105 level, possibly even lower. To the upside, if we were to somehow break above the ¥110 level, then it is likely that we could go to the upside. At that point, it would be a longer-term “buy-and-hold” type of situation. To the downside, I think this would probably be a function of rather negative economic situation and perhaps even a larger shock to the system.

