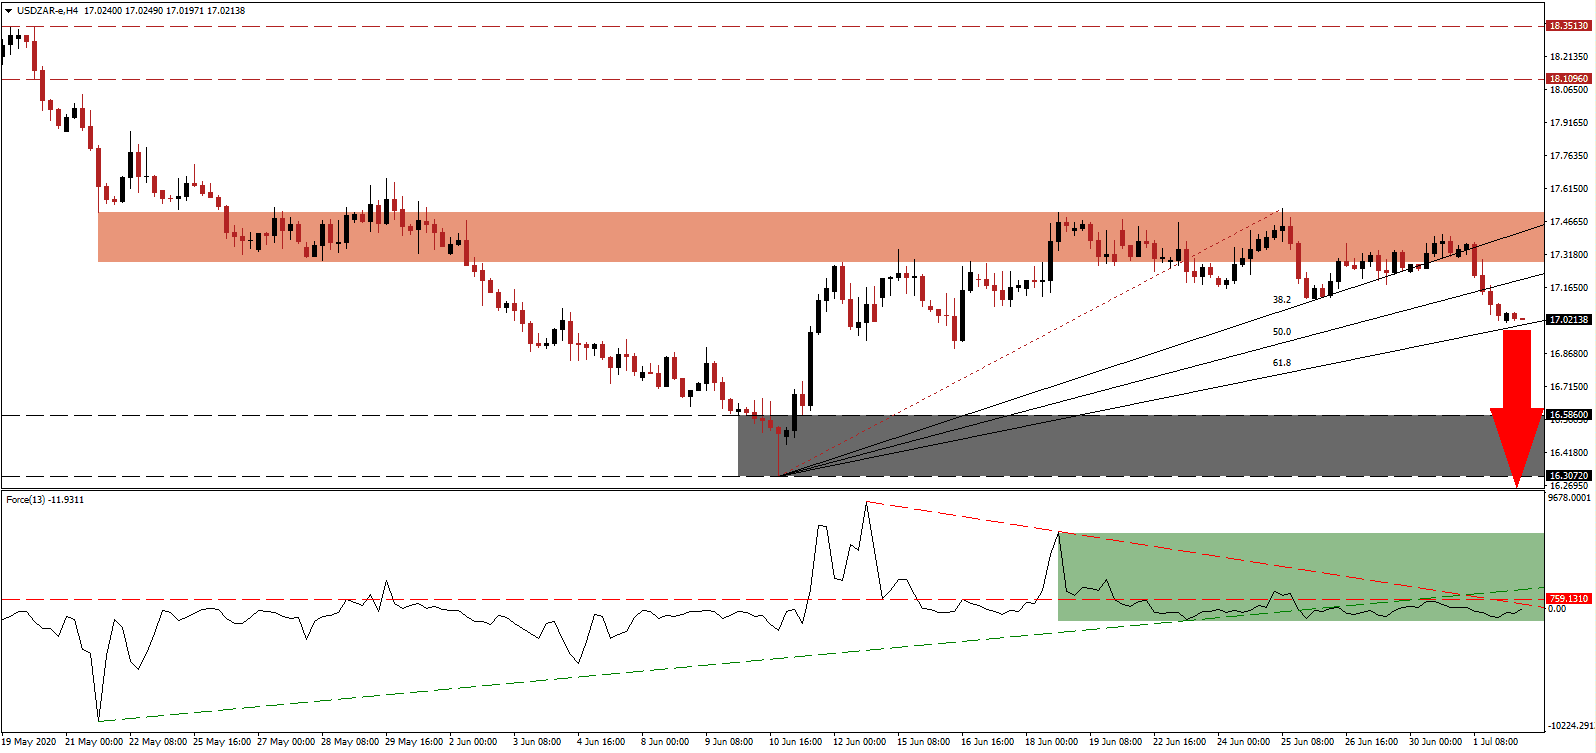
South Africa’s economy delivered the third consecutive quarterly contraction. After posting a decrease of 0.8% and 1.4%, in the third and fourth quarter of 2019, respectively, the first quarter GDP accelerated the trend with a 2.0% drop. Mining and manufacturing contributed heavily, collapsing by 21.5% and 8.5%. Utilities and construction, down 5.6% and 4.7%, added to the worrisome decline in Africa’s most industrialized nation. It resulted in the country losing the number one GDP spot to Nigeria last year. The USD/ZAR was able to complete a breakdown below its short-term resistance zone, with disappointing first-quarter priced in and the outlook for South Africa cautiously improving.
The Force Index, a next-generation technical indicator, confirms the dominance of bearish momentum and maintains its position below the horizontal resistance level. Following the breakdown below its ascending support level, the descending resistance level is exercising elevated downside pressure, as marked by the green rectangle. With this technical indicator below the 0 center-line, bears are in complete control of the USD/ZAR.
Expectations for the second-quarter GDP are grim, but the South African manufacturing sector expanded for the second consecutive month in June. Total vehicle sales are trending higher, and optimism over planned infrastructure projects supports a stronger South African Rand. Numerous issues plague the economy, but it appears that President Ramaphosa’s government is steering in the right direction. The breakdown in the USD/ZAR below its short-term resistance zone located between 17.2813 and 17.5081, as marked by the red rectangle, is anticipated to gather steam after today’s US economic data.
Due to the July 4th weekend, the June NFP report will be released today. Expectations call for 3.000 million job additions, following the surprise 2.509 created positions in May. With US employers confirming they are in no rush to rehire workers, and yesterday’s ADP coming in below forecast, today’s NFP report is well-positioned to disappoint. Initial and continuing jobless claims remain elevated, adding to concern over the health of the labor market. The USD/ZAR is favored to correct below its ascending 61.8 Fibonacci Retracement Fan Support Level, clearing the path into its support zone located between 16.3072 and 16.5860, as identified by the grey rectangle. More downside is likely to materialize.
USD/ZAR Technical Trading Set-Up - Breakdown Extension Scenario
Short Entry @ 17.0200
Take Profit @ 16.2200
Stop Loss @ 17.2200
Downside Potential: 8,000 pips
Upside Risk: 2,000 pips
Risk/Reward Ratio: 4.00
A breakout in the Force Index above its ascending support level, serving as resistance, may pressure the USD/ZAR into a temporary reversal. The upside potential is confined to the top range of its short-term resistance zone. With the Covid-19 pandemic spiraling out of control in the US, states reimposing lockdowns, quarantines, and rolling back economic reopening measures, Forex traders are advised to sell any price spike from current levels.
USD/ZAR Technical Trading Set-Up - Confined Breakout Scenario
Long Entry @ 17.3200
Take Profit @ 17.5000
Stop Loss @ 17.2200
Upside Potential: 1,800 pips
Downside Risk: 1,000 pips
Risk/Reward Ratio: 1.80

