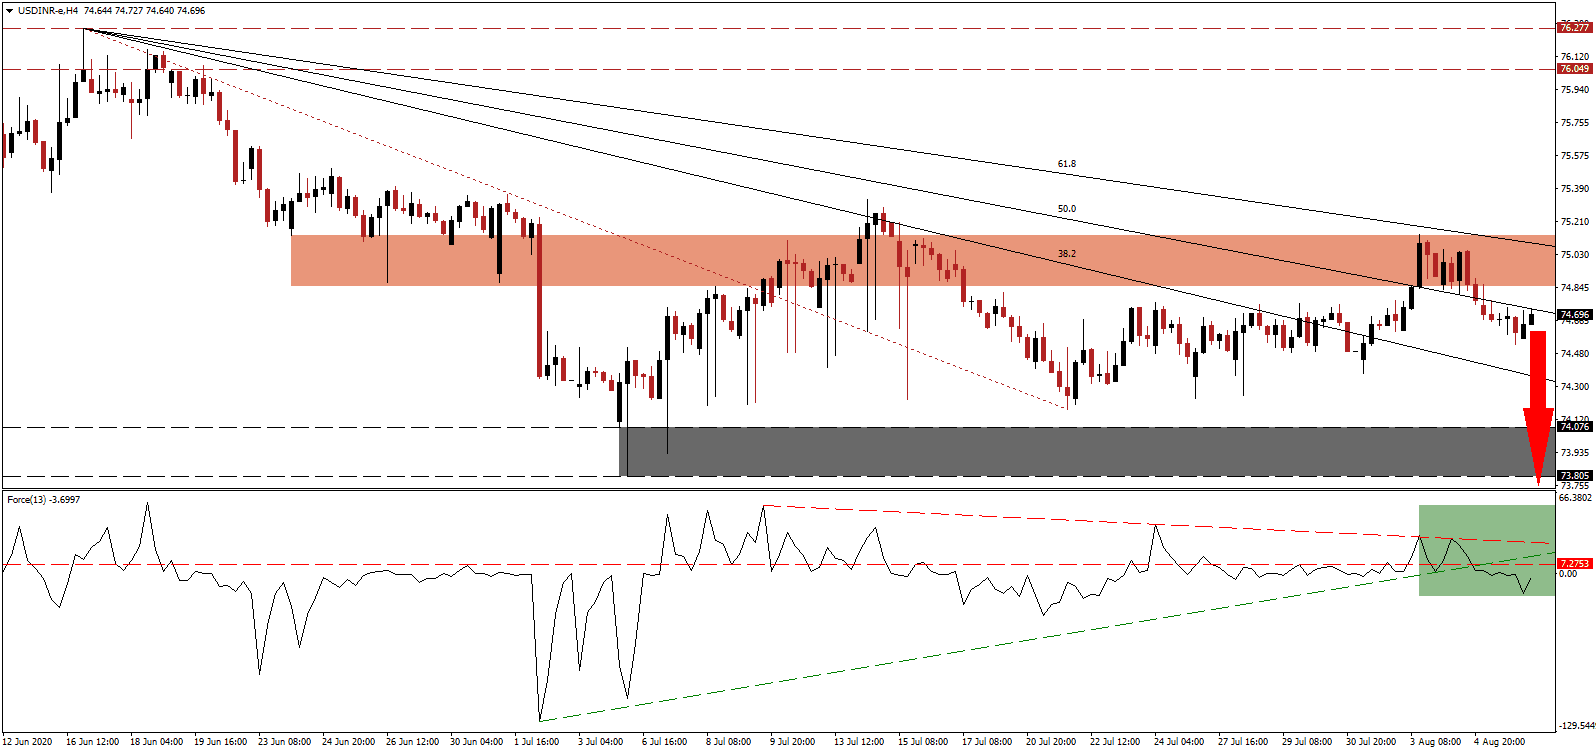
India remains under significant economic stress provided by the Covid-19 pandemic. Following a strict nationwide lockdown in April and May, a gradual recovery at the end of May and throughout June materialized amid pent-up demand. It appears that the modest recovery was short-lived and more problems are emerging. The July manufacturing PMI decreased from 47.2 to 46.0, and the service sector PMI disappointed with an increase from 33.7 to 34.2. Despite the disappointments, the USD/INR ended its counter-trend advance after the short-term resistance zone rejected price action.
The Force Index, a next-generation technical indicator, confirmed the rejection in this currency after the descending resistance level pressured it into a reversal. Conversion of its horizontal support level into resistance, as marked by the green rectangle, was followed by a breakdown below its ascending support level. After this technical indicator crossed into negative territory, bears resumed full control over the USD/INR.
More evidence of a slowing July economy is visible by the 14.3% slump in goods and services tax (GST) collection year-over-year. Ajay Bhushan Pandey, the Revenue Secretary of India, cautioned the parliamentary standing committee on finance that the government may not be able to compensate states due to the drop in GST revenues. Thirteen of the top twenty ministries already cut spending, but it is not enough to cover the shortfall in revenue. The USD/INR completed a breakdown below its short-term resistance zone located between 74.851 and 75.133, as marked by the red rectangle, adding to bearish progress.
Per analysis from IHS Markit, the outlook for Indian businesses is the worst in the world. Its sentiment indicator for India turned negative for the first time on over ten years, while the future outlook remains uncertain. Deepak Parekh, Chairman of financial services conglomerate Housing Development Finance Corporation Limited (HDFC), is confident, claiming the worst is behind India and that the economy will boom by August 2021. The descending 50.0 Fibonacci Retracement Fan Resistance Level is anticipated to drive the USD/INR into its support zone located between 73.805 and 74.076, as identified by the grey rectangle. A breakdown into its next support zone between 72.433 and 73.214 is likely.
USD/INR Technical Trading Set-Up - Breakdown Extension Scenario
Short Entry @ 74.700
Take Profit @ 73.000
Stop Loss @ 75.050
Downside Potential: 17,000 pips
Upside Risk: 3,500 pips
Risk/Reward Ratio: 4.86
Should the Force Index accelerate above its descending resistance level, the USD/INR could initiate another push higher. It will offer Forex traders should consider any advance a selling opportunity. Yesterday’s ADP report showed the addition of just 167K positions in July against expectations for 1,500K. Initial jobless claims have trended higher for two weeks, and the US government debates a reduction in the weekly subsidy to the unemployed from $600 to $200.The upside potential is reduced to its intra-day high of 75.625.
USD/INR Technical Trading Set-Up - Reduced Breakout Scenario
Long Entry @ 75.225
Take Profit @ 75.600
Stop Loss @ 75.050
Upside Potential: 3,750 pips
Downside Risk: 1,750 pips
Risk/Reward Ratio: 2.14

