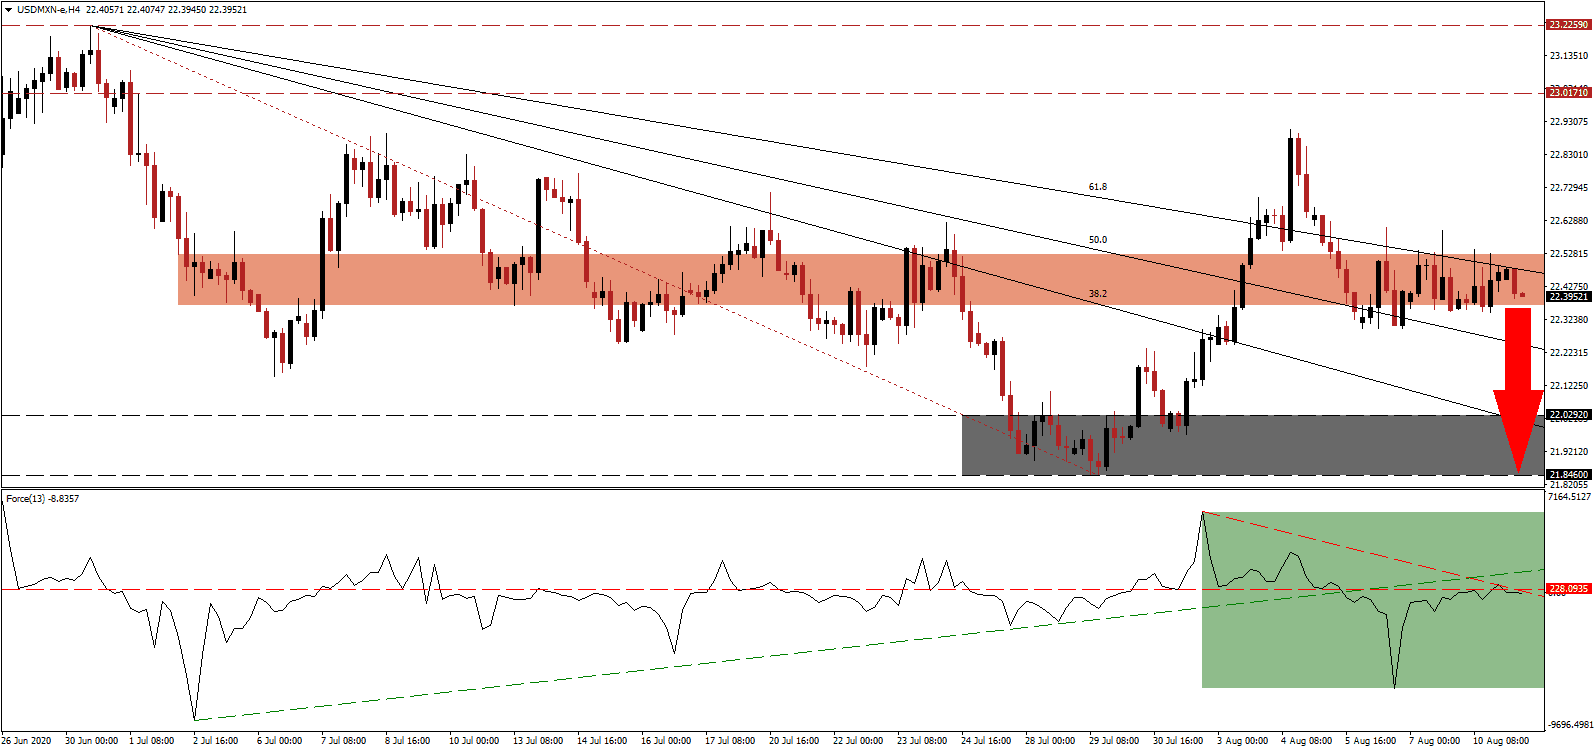
Gabriela Siller, the Director of Economic and Financial Analysis at Banco BASE, warned that a complete economic recovery for Mexico is likely to take between six and eleven years, with four years outlined as a best-case scenario. She did note that GDP contracted for five consecutive quarters, which has not materialized since the fourth-quarter of 1985 until the fourth quarter of 1986, in the aftermath of the Mexico City earthquake. She does believe the second quarter of 2020 formed the bottom. The USD/MXN remains under breakdown pressures inside of its short-term resistance zone.
The Force Index, a next-generation technical indicator, recovered from a plunge to multi-week lows, but it remains below its horizontal resistance level and its ascending support level. With the descending resistance level maintaining downside pressure, as marked by the green rectangle, and this technical indicator below the 0 center-line, bears are in complete control over the USD/MXN.
After Mexico faced a record GDP contraction of 17.3% in April, the economy decreased by 2.6% in May, per data from the Instituto Nacional de Estadística y Geografía (INEGI). While primary activities increased by 1.6%, secondary and tertiary activities decreased by 1.8% and 3.2%, respectively. The first one includes agriculture and commodities, the latter two the manufacturing and service sectors. Breakdown pressures on the USD/MXN are maintained by its descending 61.8 Fibonacci Retracement Fan Resistance level, inside of the short-term resistance zone located between 22.3671 and 22.5236, as marked by the red rectangle.
Mexico is on course to breach the 500,000 Covid-19 infection mark this week, highlighting the ongoing health crisis and crippling economic impact. One bright spot is the resiliency in remittances, despite the cut in hours worked due to the global pandemic. They hit a record $36 billion in 2019, and Mexico earns more from them than foreign direct investment (FDI), tourism, or oil exports. The first-half of 2020 saw remittances reach another record, clocking in at $19.1 billion. A breakdown in the USD/MXN into its support zone located between 21.8460 and 22.0292, as identified by the grey rectangle, is likely to result in more downside.
USD/MXN Technical Trading Set-Up - Breakdown Scenario
Short Entry @ 22.3950
Take Profit @ 21.8550
Stop Loss @ 22.5350
Downside Potential: 5,400 pips
Upside Risk: 1,400 pips
Risk/Reward Ratio: 3.86
Should the Force Index reclaim its ascending support level, serving as temporary resistance, the USD/MXN could attempt a price spike. The upside potential remains limited to its intra-day high of 22.9074, the peak from where the current sell-off emerged. Forex traders are recommended to sell any rallies from current levels, amid the intensifying bearish outlook for the US Dollar, due to rising debt, favored to increase further.
USD/MXN Technical Trading Set-Up - Limited Breakout Scenario
Long Entry @ 22.6750
Take Profit @ 23.9000
Stop Loss @ 22.5350
Upside Potential: 2,250 pips
Downside Risk: 1,400 pips
Risk/Reward Ratio: 1.61

