Canada achieved success with its Covid-19 response as compared to the US. Border restrictions, states of emergency declared across Canada, mandatory 14-day quarantines for foreign visitors, and face coverings in public, mitigated the overall impact on the health of Canadians. It resulted in just over 120,000 confirmed infections and 9,000 deaths, with a population shy of 38,000,000. The US has over 330,000,000 citizens, but recorded more than 5,400,000 cases with over 170,000 casualties. Where Canada appears to have the pandemic under control, it rages uncontrolled in the US. Therefore, the border is likely to remain closed or heavily restricted until the US implements necessary measures to gain control of the pandemic. The USD/CAD is well-positioned to extend its breakdown sequence.
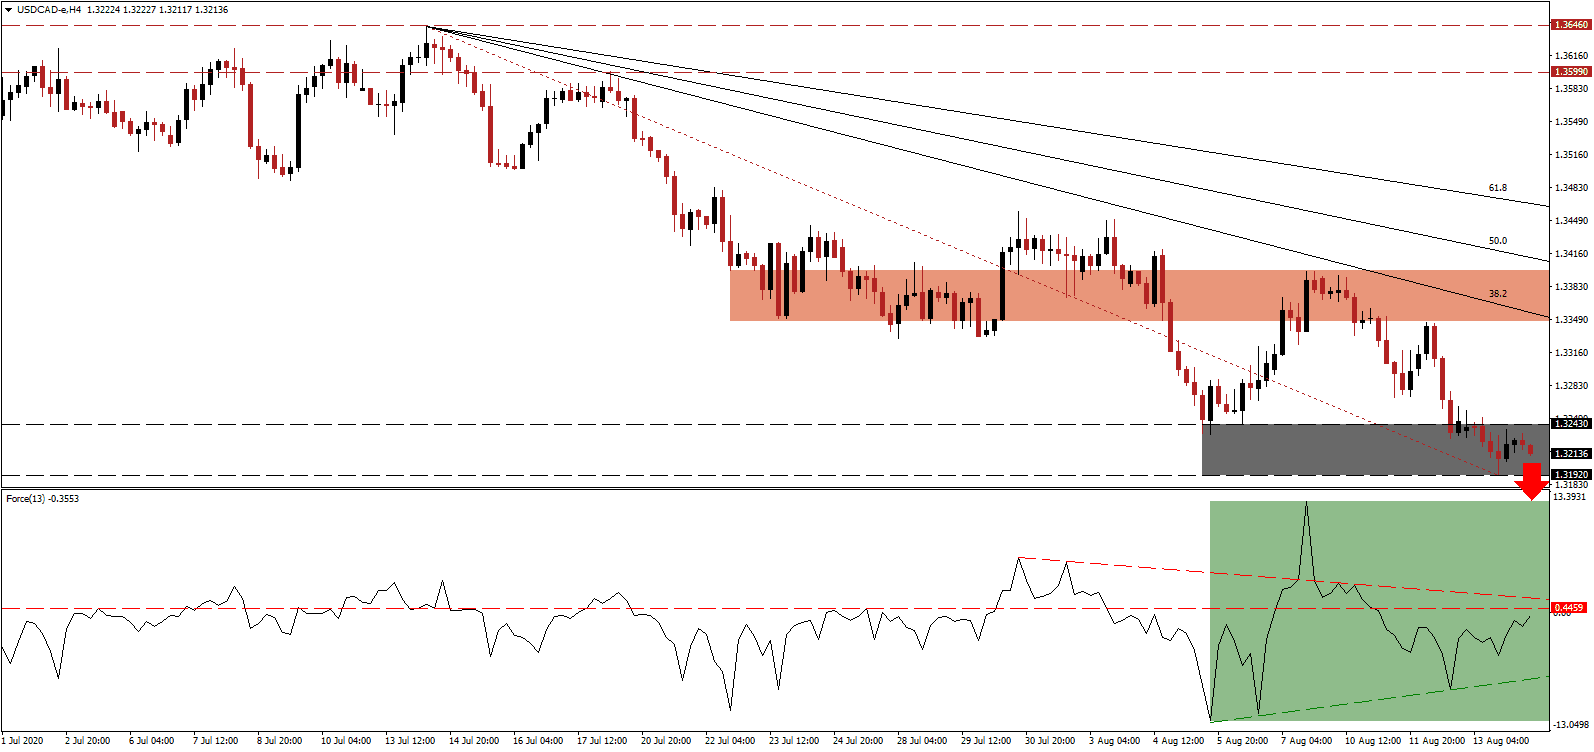
The Force Index, a next-generation technical indicator, bounced off of its ascending support level in negative territory, but price action failed to gain upside momentum. It now faces rejection by its horizontal resistance level, as marked by the green rectangle, enforced by its descending resistance level. Bears wait for a renewed collapse in this technical indicator to regain complete control over the USD/CAD.
Economists forecast a 5.2% GDP expansion in 2021, while 2020 is expected to print a 7.0% plunge. The Canadian economy is likely to reach pre-Covid levels in 2022, confirming a slow and prolonged recovery, unless an anticipated second infection wave will cause more damage than calculated. A similar pattern exists across the global economy, a scenario for which the US is ill-prepared. It adds a distinct bearish catalyst to the USD/CAD after it accelerated to the downside from its short-term resistance zone located between 1.3347 and 1.3399, as identified by the red rectangle.
Prime Minister Justin Trudeau enlisted the assistance of former Bank of England Governor Mark Carney to draft an economic recovery plan out of the crisis. It is rumored to address issues with the social safety net, climate change, infrastructure, and immigration. While a short-term price spike in the USD/CAD cannot be excluded, the descending Fibonacci Retracement Fan sequence enforces the established bearish chart pattern. A breakdown below its support zone located between 1.3192 and 1.3243, as marked by the grey rectangle, will clear the path into its next support zone between 1.3035 and 1.3104.
USD/CAD Technical Trading Set-Up - Breakdown Extension Scenario
- Short Entry @ 1.3215
- Take Profit @ 1.3035
- Stop Loss @ 1.3270
- Downside Potential: 180 pips
- Upside Risk: 55 pips
- Risk/Reward Ratio: 3.27
Should the Force Index extend its advance, guided by its ascending support level, the USD/CAD could attempt a brief counter-trend reversal. Given the deteriorating outlook for the US Dollar, plagued by debt, an out-of-control pandemic, and lack of interest to implement necessary measures, the upside potential is limited to its 50.0 Fibonacci Retracement Fan Resistance Level. Forex traders should sell any rallies moving forward.
USD/CAD Technical Trading Set-Up - Limited Reversal Scenario
- Long Entry @ 1.3320
- Take Profit @ 1.3415
- Stop Loss @ 1.3270
- Upside Potential: 95 pips
- Downside Risk: 50 pips
- Risk/Reward Ratio: 1.90

