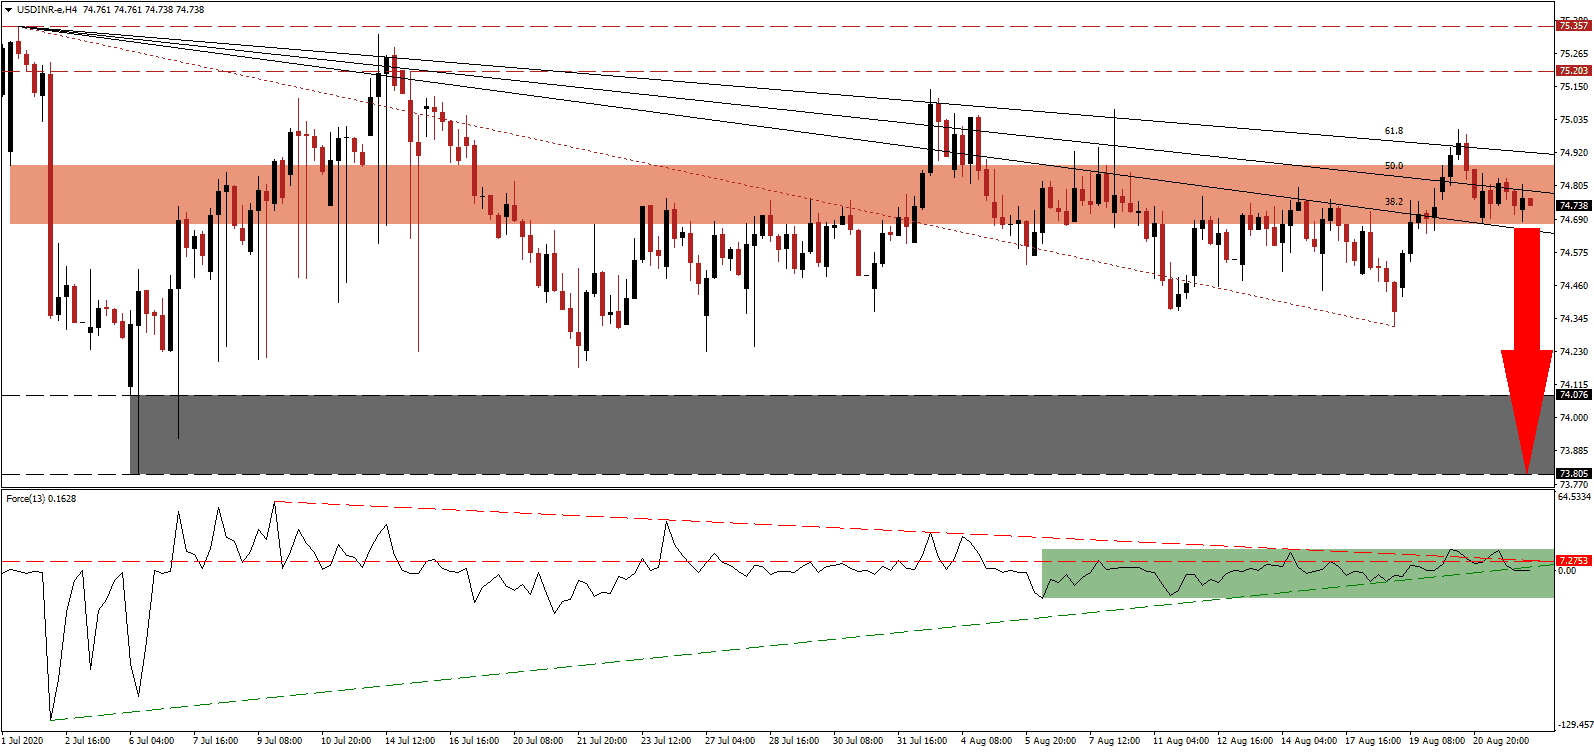
India has taken a global leadership position in new daily Covid-19 infections, in some cases higher than that of the US and Brazil combined. The size of the population, more than twice that of the US and Brazil, needs to be considered. On a more positive note, the death toll is lower, while testing remains inadequate, partially to blame on a global shortage. Prime Minister Narendra Modi continues to face criticism for the lack of fiscal stimuli, but it is premature to assess his long-term approach accurately. Excessive debt out of the US places extended downside pressure on the USD/INR, with a new breakdown pending.
The Force Index, a next-generation technical indicator, maintains its position below the horizontal resistance level, confirming the dominance of bearish momentum. Adding to downside pressures was the move below its ascending support level, as marked by the green rectangle, while the descending resistance level is magnifying it. Bears wait for this technical indicator to move below the 0 center-line to regain complete control over the USD/INR.
Before the Covid-19 pandemic resulted in a nationwide lockdown, the economy was slowing. After expanding by 4.2% in 2020, the first-quarter growth rate slowed to 3.1%. Second-quarter estimates range between a 13.6% and 25.7% plunge, but localized lockdowns remain in place to contain the pandemic. Reinforced calls for a structured alternating lockdown-and-easing policy, to combat the virus and enable sustained economic recovery, expand. The USD/INR presently tests the strength of its short-term resistance zone located between 74.672 and 74.876, as marked by the red rectangle.
Economists warn that the virus is now penetrating rural areas, adding to economic stress. Lack of consumer demand and spending power remains an essential problem. Despite short-term stress, long-term projects like privatization, healthcare infrastructure projects, and a planned agriculture investment fund, need to be given time to generate benefits. The USD/INR is well-positioned to correct below its descending 38.2 Fibonacci Retracement Fan Support Level, cleating the path for an accelerated sell-off into its support zone located between 73.805 and 74.076, as identified by the grey rectangle.
USD/INR Technical Trading Set-Up - Breakdown Scenario
Short Entry @ 74.735
Take Profit @ 73.805
Stop Loss @ 74.935
Downside Potential: 9,300 pips
Upside Risk: 2,000 pips
Risk/Reward Ratio: 4.65
Should the Force Index reclaim its ascending support level and spike higher, the USD/INR could attempt a breakout. The upside potential is reduced to its long-term resistance between 75.203 and 75.357, granting Forex traders a secondary selling opportunity. Negative progress out of the US adds to bearish pressures in the US Dollar, burdened by debt, and a depressed labor market.
USD/INR Technical Trading Set-Up - Reduced Breakout Scenario
Long Entry @ 75.100
Take Profit @ 75.330
Stop Loss @ 74.935
Upside Potential: 2,300 pips
Downside Risk: 1,650 pips
Risk/Reward Ratio: 1.39

