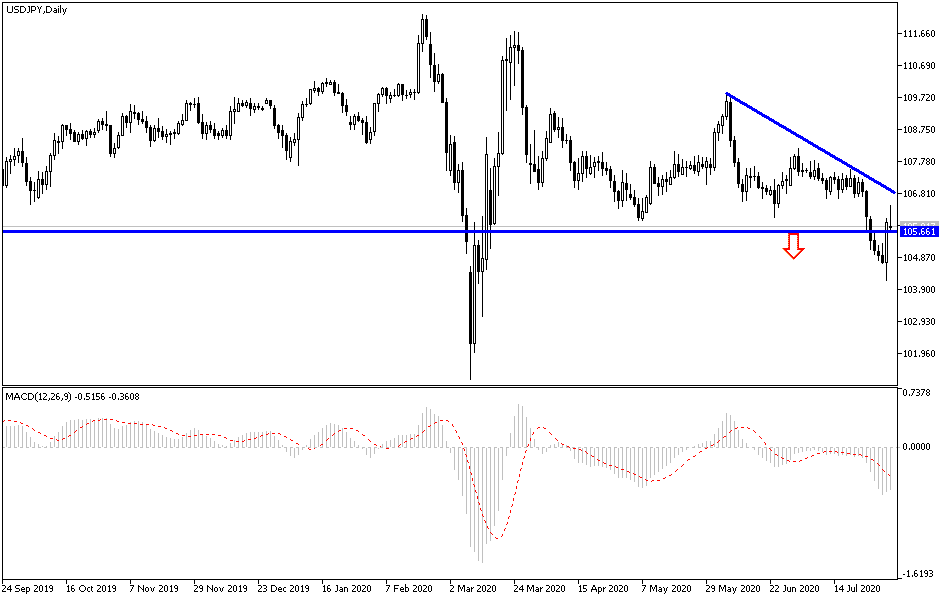
Last Friday's session was the best daily performance for the USD/JPY pair in months, as the pair bounced strongly from the 104.18 support, the lowest for 20 weeks, to the 106.05 resistance. We noted many times that the pair has reached strong and sharp oversold areas and is awaiting a bullish correction anytime. On the hourly chart, the pair stabilized between 50% and 61.80% Fib levels. RSI overbought levels have already crossed 14 hours. It is stable just above the 200-hour simple moving average while the 100-hour moving average sets many points below.
Japan's leading economic indicator in May missed expectations at 79.3 with a reading of 78.4. The coincidence index came in below 74.6 with a reading of 73.4 while the corporate services price index for June exceeded expectations (on an annual basis) of 0.5% with a reading of 0.8%. June retail sales outperformed expectations on all fronts, while June retail sales exceeded expectations by -12.3% with -3.5% reading. The jobs/applicants ratio was 1.11 lower than the expected rate of 1.16 while Japan's unemployment rate improved to 2.8%, down from 2.9%, and exceeding expectations by 3.1%. The industrial production rate also exceeded expectations.
From the United States of America, the personal income rate for June decreased by -1.1%, compared to an expected monthly decrease of 0.5%. On the other hand, the personal spending rate increased by 5.6% compared to the expected increase by 5.5%. The basic personal spending index for June on a monthly basis was as expected.
According to the technical analysis of the pair: The USD/JPY is still interacting strongly with the second COVID-19 wave, which threatens the efforts of the US administration in reviving the largest economy in the world. This is in addition to the tensions between the United States of America and China. According to the performance on the hourly chart, the USD/JPY appears to be trading in a sharp upward curve which indicates a strong short-term bullish bias in the market sentiment. The pair has already crossed the overbought levels of the RSI on the 14-hour chart. Therefore, bulls may look to extend this trend towards 61.80% and 76.40% Fibonacci at 106.05 and 106.60, respectively. On the other hand, bears will target short term retracement profits at 50% and 38.20% Fibonacci levels at 105.55 and 104.90 respectively.
On the long run, and according to the performance on the daily chart, the pair appears to be continuing in the range of its sharp bearish channel, and this indicates a long-term bearish bias in the market sentiment. Last Friday's recovery pushed the pair away from oversold levels of the 14-day RSI to the normal trading area. Thus, bulls will look for bounce targeting profits around 106.95, 107.97, and 109.23. On the other hand, bears will look for the bounce at around 104.96 and 103.98, respectively.
As for the economic calendar data today: From Japan, GDP growth will be announced From the US, the ISM Manufacturing PMI and construction spending data will be announced.


