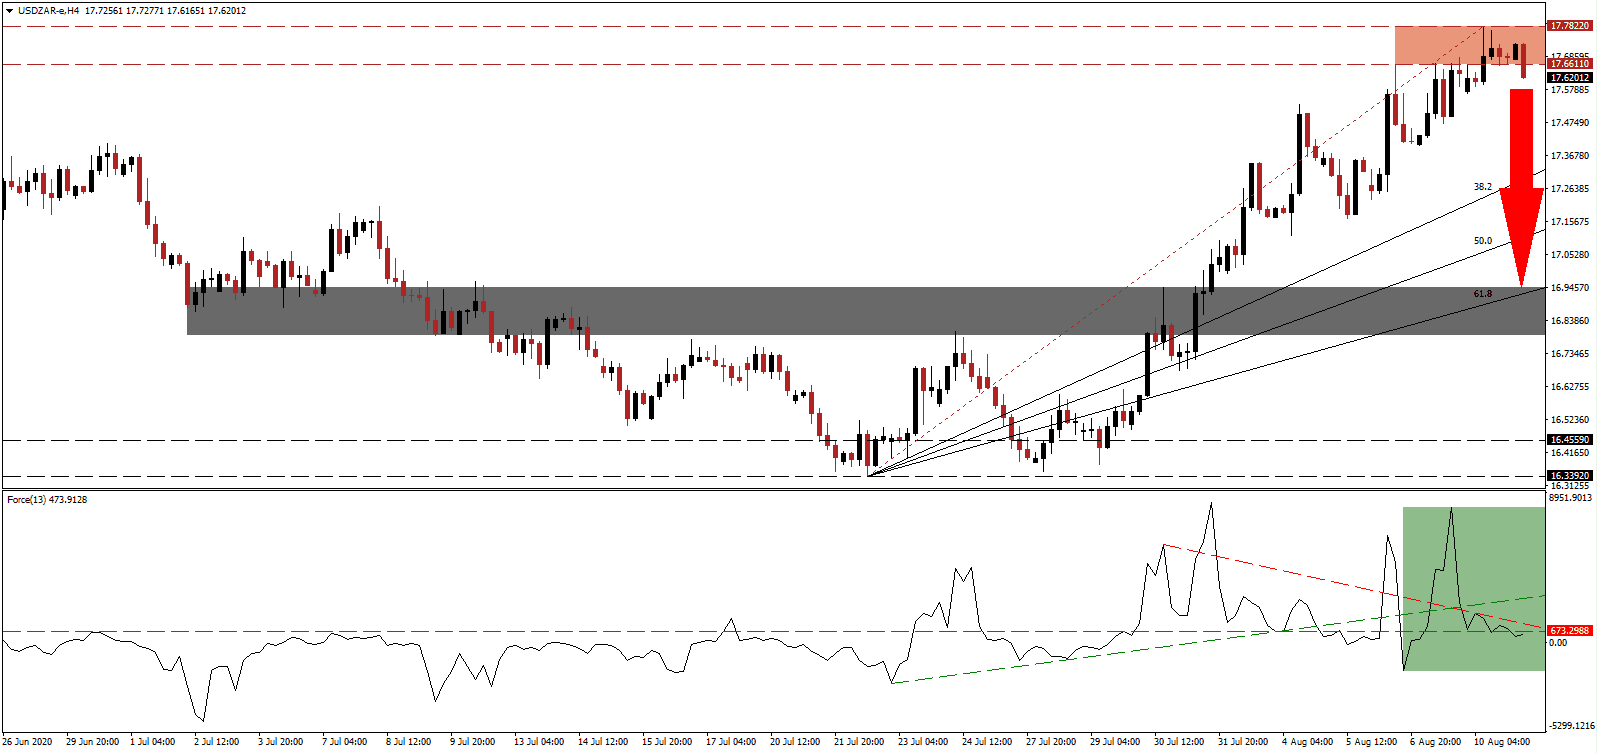
South African Reserve Bank (SARB) Governor Lesetja Kganyago defends the implemented monetary of the central bank, after growing criticism by business groups over the lack of quantitative easing measures as executed by developed economies. SARB already delivered a 300 basis-point interest rate cut to 3.50%, which adjusted for inflation leaves Africa’s most industrialized nation with real negative rates. In the second quarter, just R30 billion of government bond purchases were conducted, adding a bullish catalyst to the South African Rand. Bearish momentum in the USD/ZAR is building up, suggesting a likely sell-off and new breakdown sequence.
The Force Index, a next-generation technical indicator, experienced a volatility spike before settling lower while price action moved higher, forming a negative divergence. It has now converted its horizontal support level into resistance, as marked by the green rectangle. Following the collapse in the Force Index below its ascending support level, bearish momentum expands, and this currency pair is under pressure maintained by the descending resistance level. Once this technical indicator moves below the 0 center-line, bears will regain complete control over the USD/ZAR.
An Organisation for Economic Co-operation and Development (OECD) advisory to the South African government highlighted the need to address wide-ranging issues in the governance framework for state-owned enterprises (SOEs). They have posed a significant capital drain on public finances and layered hidden costs to the economy, while South Africa has a troubling amount of SOEs in its economy. The USD/ZAR is in the process of completing a breakdown below its resistance zone located between 17.6611 and 17.7822, as identified by the red rectangle.
With negative economic news dominating headlines, South African commodity exporters may receive a boost in export demand. Significant debt-funded stimulus packages across developed economies could lead to a short-term spike in demand. Domestically, the hydrogen economy continues to expand, together with alternative energy projects. The USD/ZAR is positioned to accelerate into its short-term support zone located between 16.7913 and 16.9456, as marked by the grey rectangle, enforced by its ascending 61.8 Fibonacci Retracement Fan Support Level.
USD/ZAR Technical Trading Set-Up - Breakdown Extension Scenario
Short Entry @ 17.6200
Take Profit @ 16.9400
Stop Loss @ 17.7900
Downside Potential: 6,800 pips
Upside Risk: 1,700 pips
Risk/Reward Ratio: 4.00
A breakout in the Force Index above its ascending support level, serving as resistance, may encourage the USD/ZAR to reverse. Forex traders should consider any push higher from present levels as an excellent selling opportunity. The US economic outlook continues to deteriorate, driven by more debt without necessary adjustments to existing models. The upside potential is reduced to its resistance zone located between 17.8759 and 18.0100.
USD/ZAR Technical Trading Set-Up - Reduced Breakout Scenario
Long Entry @ 17.8800
Take Profit @ 18.0000
Stop Loss @ 17.7900
Upside Potential: 1,200 pips
Downside Risk: 900 pips
Risk/Reward Ratio: 1.33

