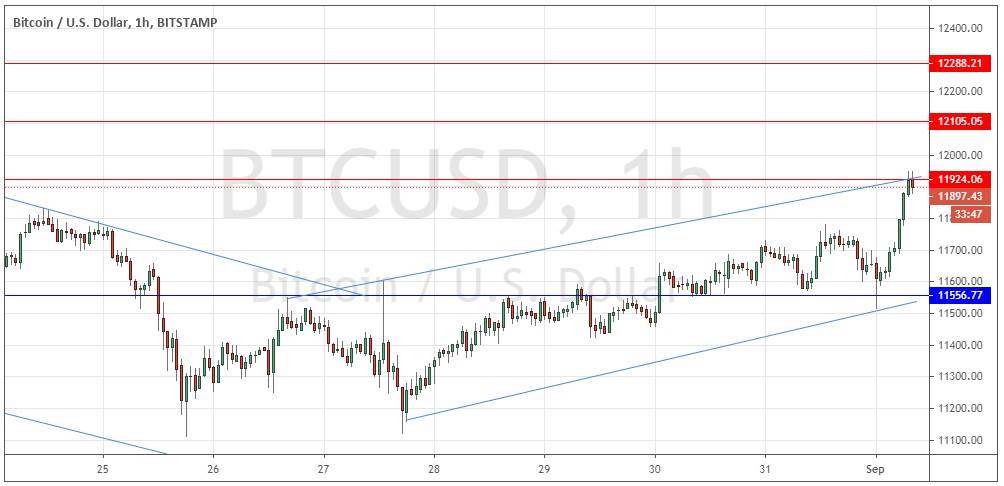
BTC/USD: Resistance at $11,924 looks pivotal now
Yesterday’s signals produced a nicely profitable long trade from the bullish rejection of the support level at $11,557. The price may not get much higher today, so it is worthwhile monitoring closely and being ready to exit from any remainder of this position if held.
Today’s BTC/USD Signals
Risk 0.50% per trade.
Trades must be taken prior to 5 pm Tokyo time Wednesday.
Long Trade Ideas
- Go long after a bullish price action reversal on the H1 time frame following the next touch of $11,557 or $10,696.
- Put the stop loss $50 below the local swing low.
- Move the stop loss to break even once the trade is $50 in profit by price.
- Take off 50% of the position as profit when the trade is $50 in profit by price and leave the remainder of the position to run.
Short Trade Ideas
- Go short after a bearish price action reversal on the H1 time frame following the next touch of $11,924, $12,105, or $12,288.
- Put the stop loss $50 above the local swing high.
- Move the stop loss to break even once the trade is $50 in profit by price.
- Take off 50% of the position as profit when the trade is $50 in profit by price and leave the remainder of the position to run.
The best method to identify a classic “price action reversal” is for an hourly candle to close, such as a pin bar, a doji, an outside or even just an engulfing candle with a higher close. You can exploit these levels or zones by watching the price action that occurs at the given levels.
BTC/USD Analysis
I wrote yesterday that the technical picture had become less bearish after the price broke out of the top of the bearish price channel. I thought that the price action looked difficult to predict. Both a short from another rejection of $11,715 or a long from a bullish bounce at $11,557 would be legitimate trades, I thought.
This was a good call as the long trade from the bounce at $11,557 gave a nicely profitable trade.
The outlook is now more bullish, and in the price chart below I have drawn a new bullish price channel which is quite symmetrical. This is a bullish sign; however, the price is showing initial signs of running into resistance at the resistant confluence of the horizontal flipping level at $11,924 and the top of that bullish price channel.
I think this level at $11,924 is going to be today’s pivotal point and I will be very happy to take a bullish bias up to the net resistance level shown if we get two consecutive hourly closes today above $11,924.
On the other hand, a conservative short trade from $11,924 might also work, but I think the long trade approach has greater potential.
Concerning the USD, there will be a release of ISM Manufacturing PMI data at 3pm London time.

