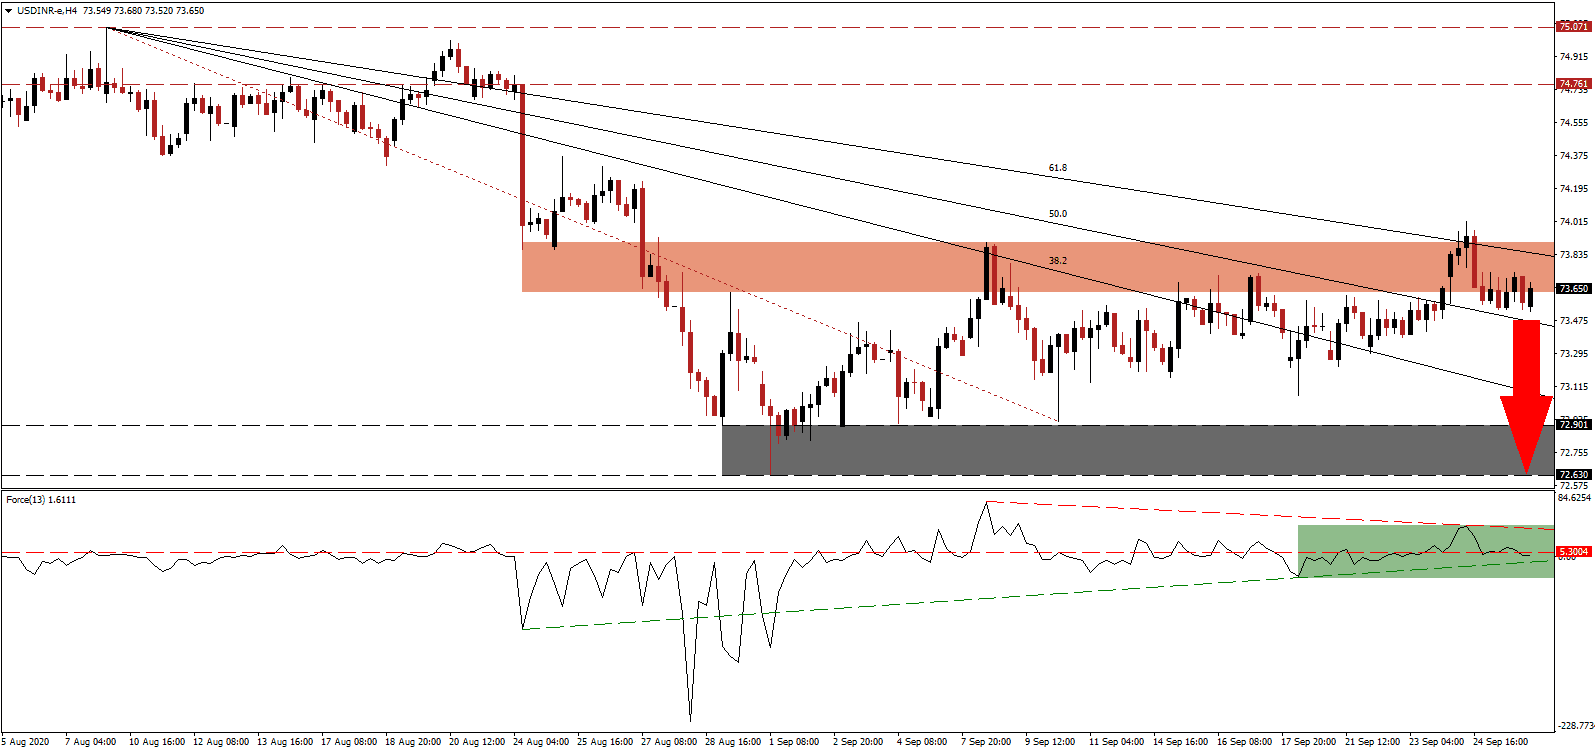
India surpassed 6,000,000 Covid-19 infections and is closing in on 100,000 confirmed deaths. The second-most populous country, and fifth-largest economy globally, struggles to contain the pandemic, while economic conditions remain depressed. India was able to slow Covid-19 in what is often referred to as Asia’s largest slum, Dharavi, an informal settlement in Mumbai, where over 1,000,000 live within a square mile. Many fear they will suffer more harm from the collapse of the local economy than from the virus. Despite medium-term worries, the Indian Rupee shows resilience against the most recent rally in the US Dollar. The USD/INR was rejected by its short-term resistance zone with more downside favored.
The Force Index, a next-generation technical indicator, retreated from a lower high and moved back below its horizontal resistance level, as marked by the green rectangle. Bearish momentum is rising, magnified by its descending resistance level, which is expected to pressure this technical indicator below its ascending support level, and into negative territory. It will place the USD/INR under full control by bears.
Per the National Council for Applied Economic Research (NCAER), the Indian economy will face a 12.6% GDP drop in the current fiscal year. In June, NCAER forecast a 1.2% growth rate, confirming the worse than the previously expected impact of Covid-19. A fiscal deficit of up to 15% of GDP is predicted to place pressure on the Reserve Bank of India (RBI), with inflation above the central bank’s target between 2.0% and 6.0%. Following the breakdown in the USD/INR below its short-term resistance zone located between 73.625 and 73.899, as identified by the red rectangle, a re-test is likely to result in more massive selling.
Given the tremendous negative economic pressures, NCAER called for ambitious reforms similar to 1991. The creation of a bad bank to absorb non-performing assets was recommended, together with incentives to lend to micro, small, and medium-sized enterprises. Arun Kumar, professor at the Institute of Social Sciences in New Delhi, added that the government of Prime Minister Narendra Modi ignored the impact on the informal economy, which accounts for 90% of all activity. A collapse in the USD/INR below its descending 50.0 Fibonacci Retracement Fan Support Level is likely to take price action into its support zone located between 72.630 and 72.901, as marked by the grey rectangle.
USD/INR Technical Trading Set-Up - Breakdown Extension Scenario
- Short Entry @ 73.650
- Take Profit @ 72.630
- Stop Loss @ 73.920
- Downside Potential: 10,200 pips
- Upside Risk: 2,700 pips
- Risk/Reward Ratio: 3.78
Should the Force Index spike above its descending resistance level, the USD/INR could attempt to pressure for more short-term upside. Given the worsening economic outlook for the US, the upside potential is reduced to its intra-day high of 74.370, a previous peak that ended in a massive price plunge. Forex traders should sell any rallies in price action from current levels.
USD/INR Technical Trading Set-Up - Reduced Breakout Scenario
- Long Entry @ 74.090
- Take Profit @ 74.320
- Stop Loss @ 73.920
- Upside Potential: 2,300 pips
- Downside Risk: 1,700 pips
- Risk/Reward Ratio: 1.35

